Oil Price Analysis: Refined Oil Inventory Decrease, Crude Oil Inventory Accumulation – This Discrepancy Reveals Which Layer of Supply Ease?
2026-09-23 20:56:13
On Wednesday, September 23, crude oil pricing returned to the cross-validation of supply availability and risk premium. Brent crude returned to around $100 per barrel; however, since its recent high of $109.72 per barrel, it has fallen by more than 9.5%, marking its longest losing streak since August 2025. The market shifted its pricing weight from whether Middle East supply disruptions would become entrenched to three verifiable clues: the resumption of Saudi Arabia's east-west pipeline, the official description of the US-Iranian delegation's contacts as productive, and market analysis indicating that the expected recovery in Saudi exports, diplomatic progress, and unexpected inventory accumulation have collectively eased concerns about Middle East supply disruptions. Despite the significant pullback, Brent crude is still more than 60% higher than its beginning-of-year level. 
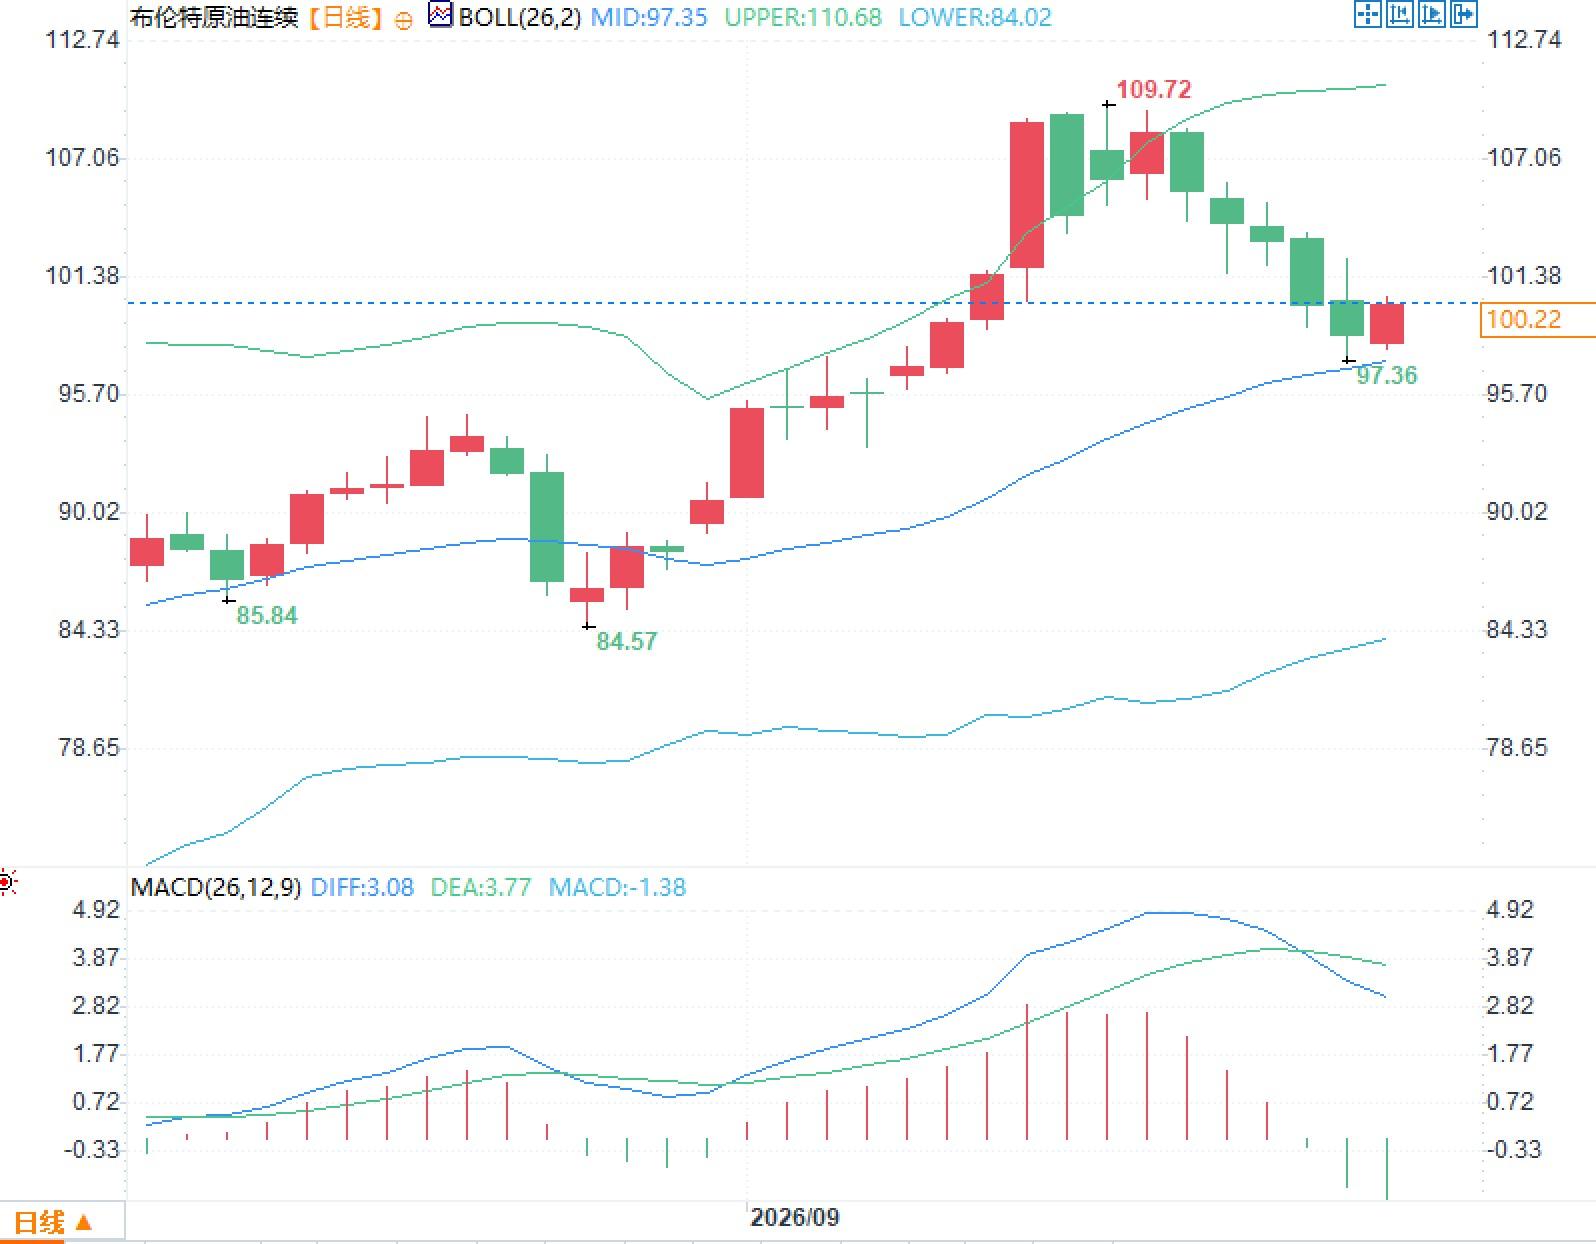 Earlier in the trading session, two lows were observed at $85.84/barrel and $84.57/barrel, remnants of the volatility seen in late August. The 52-week range is from $58.72/barrel to $126.41/barrel, a reminder that crude oil pricing this year has consistently been within a high-volatility framework.
Saudi pipeline restart rewrites short-term supply elasticity
Saudi Arabia's east-west pipeline resumed operation on September 22, and loading at Yanbu port was also ready to restart. This pipeline, connecting the eastern production region with the Red Sea export end, has a designed capacity of approximately 7 million barrels per day and bypasses the Strait of Hormuz. After the conflict disrupted loading in the Gulf, Saudi Arabia used this pipeline to divert approximately 4 million barrels per day, accounting for about 4% of global supply. Following the drone attack on September 11 that forced the pipeline to shut down and loading at Yanbu to cease, the market viewed this flow as a "temporarily missing but still viable" source of flexible supply. The current resumption is a reduced-load restart; some pumping stations have been damaged, and full recovery may take several weeks. The more direct implication for pricing is that the bypass route has regained physical availability, partially removing the "single export route" factor from the risk premium. Meanwhile, Saudi Arabia continues to increase loading through the Strait of Hormuz, with approximately 14 million barrels recorded being loaded onto supertankers around the weekend. The parallel operation of pipelines and the strait dual channels makes the short-term tradable supply more flexible than during shutdowns. This is the supply-side basis for the continued price decline, rather than a one-off conclusion about the medium- to long-term balance.How diplomatic engagement can reduce geopolitical premiums
During the UN General Assembly, the US and Iranian delegations held approximately three hours of talks. US President Donald Trump described the talks as "very good, very productive," and indicated that "another meeting will be scheduled soon." He also stated, "I think there's considerable momentum for an agreement, that's what we've heard from all sides." US participants included Special Envoy Steve Vitkov and Jared Kushner. Vitkov stated that the two sides completed a round of discussions "hopefully constructive" through mediators shuttling throughout the day, and that mediation efforts will continue. Market reaction is not based on an agreement already being finalized, but rather on a shift in pricing logic from "pure upgrade premium" to "whether the diplomatic process can be traded." The continued presence of hawkish statements during the same period indicates that premium compression is a probability repricing, not a risk elimination. The Strait of Hormuz remains a crucial node for global crude oil transportation; any new information regarding navigation, escort, and loading schedules will quickly reshape the near-month and far-month structures. The continuous decline corresponds to a temporary dismantling of the premium, not the disappearance of Middle Eastern logistical constraints.Unexpected inventory accumulation and official data window
Data from the American Petroleum Institute (API) showed that U.S. commercial crude oil inventories increased by approximately 1.7 million barrels in the week ending September 18, compared to market expectations of a decrease of approximately 578,000 barrels. Gasoline and distillate fuel inventories each decreased by approximately 2.2 million barrels. Cushing crude oil inventories also saw an increase of approximately 2.08 million barrels. The coexistence of crude oil inventory accumulation and refined product inventory reduction indicates that the pressure is more on the book supply of unprocessed crude oil than on a sudden collapse in end-user fuel demand. The market then turned its attention to the official inventory data to be released by the U.S. Energy Information Administration at 22:30 today to verify the direction and magnitude of industry data. For traders, the significance of this window lies in calibrating whether the inventory accumulation is a one-time mismatch or a period of more than two weeks of ample supply, rather than extrapolating a single week's data into a trend. Minor adjustments in refinery operating rates, import schedules, and strategic reserves can all introduce noise into the weekly figures; therefore, the structural breakdown of the official report (commercial inventories, Cushing, refined product inventories) is more worthy of comparison than the figures in the title.Daily indicators
The Brent crude oil daily Bollinger Bands show the middle band at $97.35/barrel, the upper band at $110.68/barrel, and the lower band at $84.02/barrel. After retreating from near the upper band at $109.72/barrel, the price is currently trading near the middle band. The MACD parameters are DIFF at 3.08, DEA at 3.77, and the MACD histogram at -1.38. The fast line is now below the slow line, and the histogram has turned negative. These readings describe the volatility and momentum: the bandwidth remains wide, indicating that the volatility left by the previous price shock has not yet subsided. Earlier in the trading session, two lows were observed at $85.84/barrel and $84.57/barrel, remnants of the volatility seen in late August. The 52-week range is from $58.72/barrel to $126.41/barrel, a reminder that crude oil pricing this year has consistently been within a high-volatility framework.
- Risk Warning and Disclaimer
- The market involves risk, and trading may not be suitable for all investors. This article is for reference only and does not constitute personal investment advice, nor does it take into account certain users’ specific investment objectives, financial situation, or other needs. Any investment decisions made based on this information are at your own risk.