Hawkish signals from the Federal Reserve have increased expectations of interest rate hikes, causing spot gold to fluctuate lower. Be wary of a break below the current trading range support level.
2026-09-24 10:06:13
Spot gold continued its downward trend in early Asian trading on Thursday, with XAU/USD falling to around $4270 at one point. After a rapid pullback from previous highs, market focus shifted back to the Federal Reserve's monetary policy path. Since gold itself does not generate interest, the increased market expectations for future interest rates have raised the opportunity cost of holding gold relative to dollar assets and other yield-generating assets, thus putting downward pressure on gold prices.  This week, Federal Reserve officials' policy statements clearly leaned towards cautious tightening. Fed Governor Michael Barr stated that further policy adjustments may still be needed to control inflation; Richmond Fed President Tom Barkin and Boston Fed President Susan Collins also supported the recent rate hike decision, noting that inflationary pressures remain. These statements reinforced market expectations that the Fed may continue its restrictive policy for the remainder of the year. Changes in the interest rate market are already quite evident. CME FedWatch data shows that the market currently expects a 69.7% probability of a 25 basis point rate hike in October, compared to about 48.7% a week ago. If future US inflation and employment data continue to show resilience, market pricing in further rate hikes may intensify, supporting the dollar and US Treasury yields, while gold faces greater valuation pressure. Some precious metals market participants believe that the overall hawkish tone of the Fed officials' post-meeting remarks indicates the market is re-incorporating the possibility of at least one more rate hike this year, a significant reason for the recent pressure on gold. However, the current adjustment in gold is not solely determined by interest rate factors; changes in physical demand also warrant attention. Despite global investors reducing their gold holdings due to expectations of US interest rates, physical purchases and ETF funds in the Asian market may still provide some buffer. If the US dollar continues to strengthen and US real interest rates rise further, gold will still face short-term downward pressure; however, if price declines reignite physical buying in Asia, demand support at lower levels may strengthen. From a sentiment perspective, the gold market is currently showing significant divergence. On the one hand, hawkish signals from the Federal Reserve have reinforced expectations of "higher interest rates for a longer period," with a stronger dollar directly suppressing gold. On the other hand, after the previous rapid price adjustment, some long-term funds and physical buyers may begin to focus on allocation opportunities arising from price declines. Therefore, the current market situation is more like a rebalancing between macroeconomic interest rate factors and actual demand forces, rather than a one-way trend. Going forward, key attention should be paid to speeches by Federal Reserve officials, US inflation and employment data, changes in the US dollar index and US Treasury real yields. Meanwhile, Asian gold imports, ETF holdings, and the Shanghai market premium are also important indicators for judging the strength of demand at lower levels. If US interest rate expectations continue to rise, gold may further test technical support; if the dollar and yields experience a phased decline, the potential for a rebound in gold after its oversold condition may reopen. From the daily chart, spot gold is currently trading below the 100-day simple moving average and the 20-day Bollinger Band, indicating a weak short-term technical structure. At the current price of approximately $4270, the market should first focus on the technical resistance near the 100-day moving average, followed by the Bollinger Band middle line near $4375. This area is also a crucial level for determining whether gold prices can regain strength. If the price can stabilize above $4375, further attention should be paid to the upper Bollinger Band near $4530; below, the lower Bollinger Band near $4222 is a key support level for the current medium term. The RSI (14) is approximately 45, not yet in the oversold zone, indicating weak momentum but still in a consolidation phase, with no extreme bearish signal yet. Looking at the 4-hour chart, gold is still in a weak consolidation structure after a pullback in the short term. During the rebound, the resistance level of the $4300-$4375 area needs to be closely observed. If prices fail to break through $4375 again, the short-term rebound may still be seen as a corrective move, with a potential retest of the $4250 or even $4222 support levels. Conversely, if gold prices can break through $4375 with significant volume and hold above it, the short-term downtrend may improve, potentially leading to a further correction towards the $4450-$4530 range. Since the daily RSI is not yet clearly oversold, the risk of a second pullback due to changes in interest rate expectations remains.
 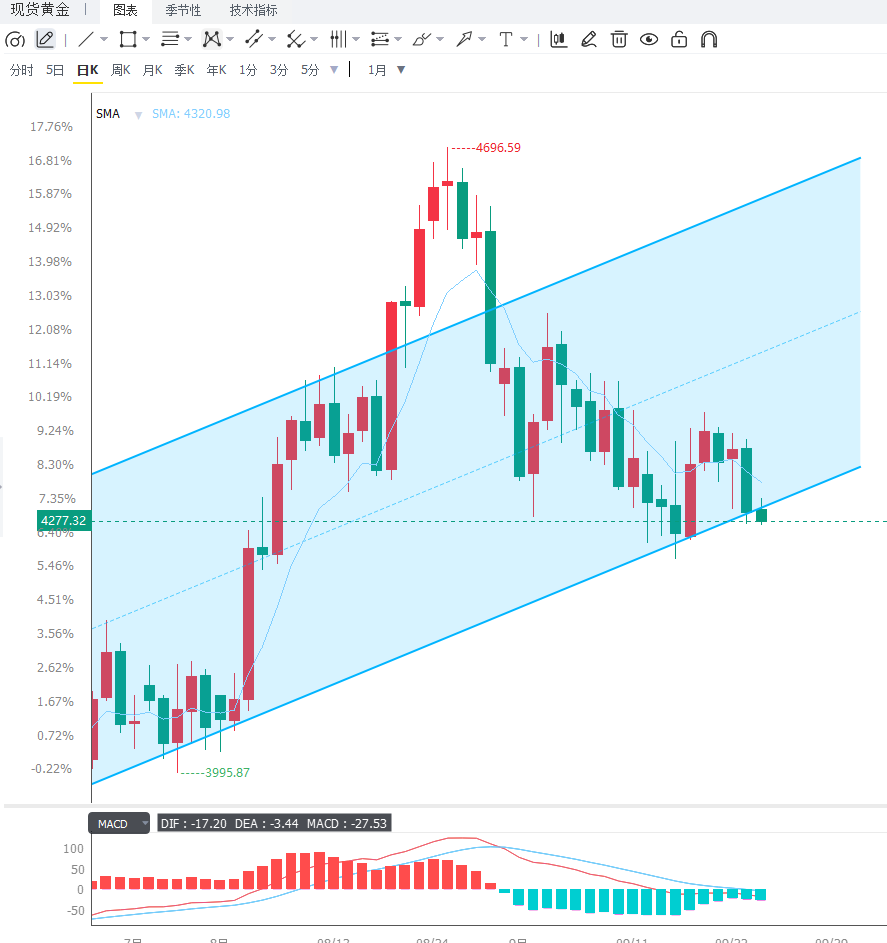 Editor's Summary: Gold is currently at a critical juncture, oscillating between expectations of Federal Reserve policy and physical demand. Hawkish policy signals and rising expectations of an October rate hike are the main factors suppressing short-term gold prices; meanwhile, continued growth in gold imports and ETF demand from major Asian countries provides strong fundamental support for prices. In the short term, the price action around $4290 remains weak, with $4222 acting as a significant support level and $4375 as a key resistance level to determine whether a rebound can continue. Going forward, the US dollar, real interest rates, and expectations of Federal Reserve policy will continue to determine the direction of gold prices, while physical demand from major Asian countries may act as a significant buffer during any price correction.
This week, Federal Reserve officials' policy statements clearly leaned towards cautious tightening. Fed Governor Michael Barr stated that further policy adjustments may still be needed to control inflation; Richmond Fed President Tom Barkin and Boston Fed President Susan Collins also supported the recent rate hike decision, noting that inflationary pressures remain. These statements reinforced market expectations that the Fed may continue its restrictive policy for the remainder of the year. Changes in the interest rate market are already quite evident. CME FedWatch data shows that the market currently expects a 69.7% probability of a 25 basis point rate hike in October, compared to about 48.7% a week ago. If future US inflation and employment data continue to show resilience, market pricing in further rate hikes may intensify, supporting the dollar and US Treasury yields, while gold faces greater valuation pressure. Some precious metals market participants believe that the overall hawkish tone of the Fed officials' post-meeting remarks indicates the market is re-incorporating the possibility of at least one more rate hike this year, a significant reason for the recent pressure on gold. However, the current adjustment in gold is not solely determined by interest rate factors; changes in physical demand also warrant attention. Despite global investors reducing their gold holdings due to expectations of US interest rates, physical purchases and ETF funds in the Asian market may still provide some buffer. If the US dollar continues to strengthen and US real interest rates rise further, gold will still face short-term downward pressure; however, if price declines reignite physical buying in Asia, demand support at lower levels may strengthen. From a sentiment perspective, the gold market is currently showing significant divergence. On the one hand, hawkish signals from the Federal Reserve have reinforced expectations of "higher interest rates for a longer period," with a stronger dollar directly suppressing gold. On the other hand, after the previous rapid price adjustment, some long-term funds and physical buyers may begin to focus on allocation opportunities arising from price declines. Therefore, the current market situation is more like a rebalancing between macroeconomic interest rate factors and actual demand forces, rather than a one-way trend. Going forward, key attention should be paid to speeches by Federal Reserve officials, US inflation and employment data, changes in the US dollar index and US Treasury real yields. Meanwhile, Asian gold imports, ETF holdings, and the Shanghai market premium are also important indicators for judging the strength of demand at lower levels. If US interest rate expectations continue to rise, gold may further test technical support; if the dollar and yields experience a phased decline, the potential for a rebound in gold after its oversold condition may reopen. From the daily chart, spot gold is currently trading below the 100-day simple moving average and the 20-day Bollinger Band, indicating a weak short-term technical structure. At the current price of approximately $4270, the market should first focus on the technical resistance near the 100-day moving average, followed by the Bollinger Band middle line near $4375. This area is also a crucial level for determining whether gold prices can regain strength. If the price can stabilize above $4375, further attention should be paid to the upper Bollinger Band near $4530; below, the lower Bollinger Band near $4222 is a key support level for the current medium term. The RSI (14) is approximately 45, not yet in the oversold zone, indicating weak momentum but still in a consolidation phase, with no extreme bearish signal yet. Looking at the 4-hour chart, gold is still in a weak consolidation structure after a pullback in the short term. During the rebound, the resistance level of the $4300-$4375 area needs to be closely observed. If prices fail to break through $4375 again, the short-term rebound may still be seen as a corrective move, with a potential retest of the $4250 or even $4222 support levels. Conversely, if gold prices can break through $4375 with significant volume and hold above it, the short-term downtrend may improve, potentially leading to a further correction towards the $4450-$4530 range. Since the daily RSI is not yet clearly oversold, the risk of a second pullback due to changes in interest rate expectations remains. Editor's Summary: Gold is currently at a critical juncture, oscillating between expectations of Federal Reserve policy and physical demand. Hawkish policy signals and rising expectations of an October rate hike are the main factors suppressing short-term gold prices; meanwhile, continued growth in gold imports and ETF demand from major Asian countries provides strong fundamental support for prices. In the short term, the price action around $4290 remains weak, with $4222 acting as a significant support level and $4375 as a key resistance level to determine whether a rebound can continue. Going forward, the US dollar, real interest rates, and expectations of Federal Reserve policy will continue to determine the direction of gold prices, while physical demand from major Asian countries may act as a significant buffer during any price correction.
- Risk Warning and Disclaimer
- The market involves risk, and trading may not be suitable for all investors. This article is for reference only and does not constitute personal investment advice, nor does it take into account certain users’ specific investment objectives, financial situation, or other needs. Any investment decisions made based on this information are at your own risk.