The US dollar index remains volatile around the 101 level. This week's non-farm payroll and PCE data will dominate expectations for a Fed rate hike.
2026-09-28 14:48:14
The US dollar traded sideways at the start of the week, with the US Dollar Index (DXY) hovering around 101.10 during the Asian trading session. Market attention quickly shifted to the plethora of US economic data released this week, particularly the September non-farm payroll report. With the Federal Reserve having already raised interest rates by 25 basis points to 3.75%-4.00% at its September meeting, subsequent employment and inflation data will directly influence the market's repricing of the October policy path.  This week sees a significantly increased density of US economic data releases. JOLTS job openings data will be released on September 29th, August personal income and spending, along with the PCE price index, will be released on September 30th, ADP employment changes and the ISM manufacturing PMI will be released on October 1st, and the September non-farm payrolls report will be released on October 2nd. The New York Fed's economic indicators calendar also shows that the PCE, ADP, ISM manufacturing, and employment reports will be key economic data points this week. Among these, the non-farm payrolls data remains a crucial catalyst for the short-term movement of the US dollar. If job growth remains resilient, and the unemployment rate and wage data do not show significant signs of cooling, the market may further assess the sustainability of US inflationary pressures and readjust its expectations for the Fed's subsequent interest rate hike path. Conversely, if the employment data is significantly weaker than market expectations, it may reduce expectations for further monetary tightening, thus putting short-term pressure on the dollar. The PCE price index is also worth noting. The market continues to observe whether US inflation can fall back towards the Fed's 2% target. St. Louis Federal Reserve President Musalaim recently stated that persistent inflationary pressures may require further interest rate hikes, noting that energy, import prices, and other commodity costs still pose inflationary risks. Market pricing suggests that investors' expectations for another Fed rate hike at the October meeting remain high. Latest market information indicates a 68% probability of a rate hike in October, meaning that if this week's economic data further strengthens inflation and employment resilience, the dollar may receive new support; conversely, if the data weakens overall, interest rate expectations may undergo a rapid correction. Meanwhile, rising oil prices and the situation in the Middle East remain external variables that the dollar market cannot ignore. If energy prices remain high, they may influence market judgments on the policy paths of major central banks through inflation expectations, further transmitting to the dollar, US Treasury yields, and the gold market. Recent market trading has already shown a stronger correlation between oil prices and Fed rate hike expectations. From a funding perspective, the dollar may be influenced by two forces this week. On the one hand, strong US employment and inflation data will continue to support a higher interest rate environment and the yield advantage of dollar assets; on the other hand, if economic data shows a significant cooling, the market may re-trade for slower economic growth and the possibility of future policy shifts. Therefore, the short-term direction of the US dollar still depends on the marginal impact of data on interest rate expectations, rather than a single economic indicator. The US dollar index is currently trading around 101.10 on the daily chart, with the price continuing to run above the 20-day exponential moving average of 100.19, and the overall short-term structure remains relatively strong. The RSI (14) has risen to 68.36, which is close to the overbought zone of 70, indicating that the bullish momentum is quite obvious, but it also means that the probability of a technical consolidation after further gains in the US dollar is increasing. The first thing to watch below is the 20-day EMA around 100.19, which is an important defensive area for the current short-term bullish structure. If the US dollar index can continue to stabilize above this moving average, the short-term strong pattern may continue; if it falls below 100.19, we need to be wary of a deeper correction in the previous upward trend. The important resistance above is around the previous high of 101.80, and the US dollar index still has room to test the high. However, the RSI approaching the overbought zone means that the momentum for chasing gains may gradually slow down, so the subsequent market is more likely to be driven by US employment, PCE inflation, and changes in the Fed's interest rate expectations.
 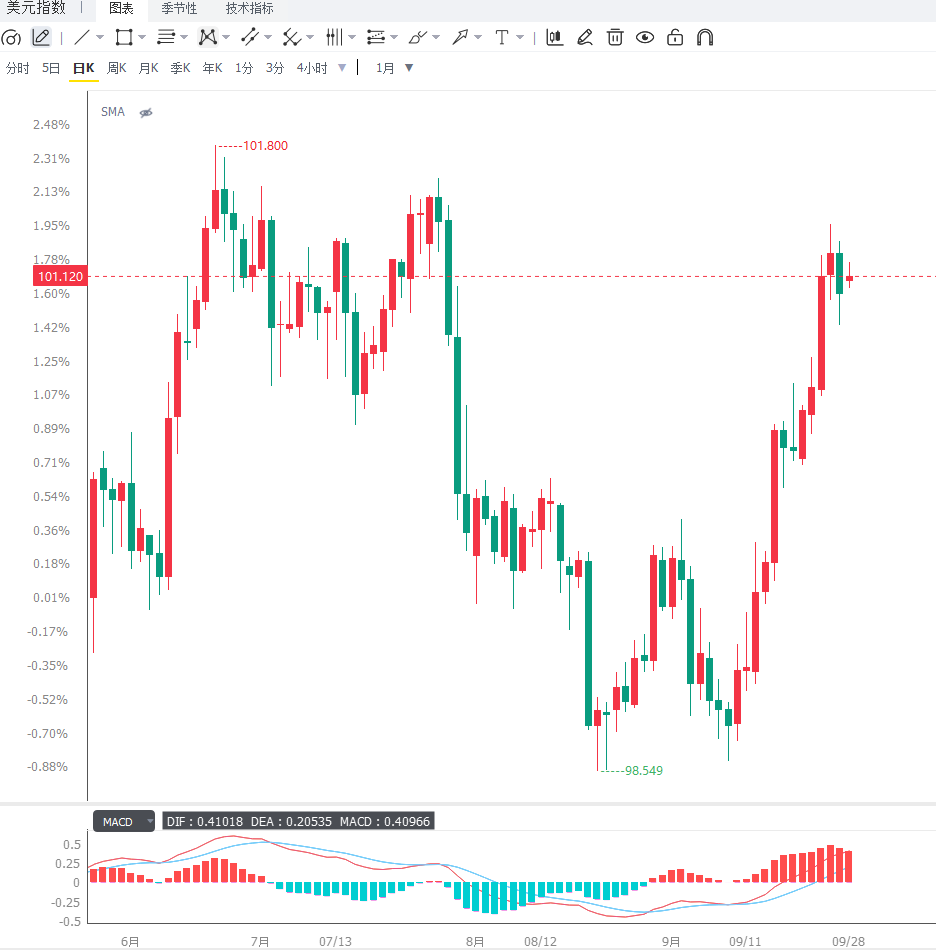 Editor's Summary: The US dollar index has maintained strong fluctuations around the 101 level. This week's US economic data will be the core factor determining its short-term direction. JOLTS, PCE, ADP, and ISM Manufacturing PMI will provide clues about employment and inflation, while the September non-farm payrolls report may be a key point for repricing the Fed's October policy expectations. Meanwhile, oil prices and the situation in the Middle East may still influence the dollar and US interest rate markets through inflation expectations. Technically, the 20-day EMA around 100.19 is an important level to watch for in the short-term bullish structure of the dollar. If the price continues to hold above this level, the market should remain wary of the possibility of further upward fluctuations and strengthening of the dollar at higher levels.
This week sees a significantly increased density of US economic data releases. JOLTS job openings data will be released on September 29th, August personal income and spending, along with the PCE price index, will be released on September 30th, ADP employment changes and the ISM manufacturing PMI will be released on October 1st, and the September non-farm payrolls report will be released on October 2nd. The New York Fed's economic indicators calendar also shows that the PCE, ADP, ISM manufacturing, and employment reports will be key economic data points this week. Among these, the non-farm payrolls data remains a crucial catalyst for the short-term movement of the US dollar. If job growth remains resilient, and the unemployment rate and wage data do not show significant signs of cooling, the market may further assess the sustainability of US inflationary pressures and readjust its expectations for the Fed's subsequent interest rate hike path. Conversely, if the employment data is significantly weaker than market expectations, it may reduce expectations for further monetary tightening, thus putting short-term pressure on the dollar. The PCE price index is also worth noting. The market continues to observe whether US inflation can fall back towards the Fed's 2% target. St. Louis Federal Reserve President Musalaim recently stated that persistent inflationary pressures may require further interest rate hikes, noting that energy, import prices, and other commodity costs still pose inflationary risks. Market pricing suggests that investors' expectations for another Fed rate hike at the October meeting remain high. Latest market information indicates a 68% probability of a rate hike in October, meaning that if this week's economic data further strengthens inflation and employment resilience, the dollar may receive new support; conversely, if the data weakens overall, interest rate expectations may undergo a rapid correction. Meanwhile, rising oil prices and the situation in the Middle East remain external variables that the dollar market cannot ignore. If energy prices remain high, they may influence market judgments on the policy paths of major central banks through inflation expectations, further transmitting to the dollar, US Treasury yields, and the gold market. Recent market trading has already shown a stronger correlation between oil prices and Fed rate hike expectations. From a funding perspective, the dollar may be influenced by two forces this week. On the one hand, strong US employment and inflation data will continue to support a higher interest rate environment and the yield advantage of dollar assets; on the other hand, if economic data shows a significant cooling, the market may re-trade for slower economic growth and the possibility of future policy shifts. Therefore, the short-term direction of the US dollar still depends on the marginal impact of data on interest rate expectations, rather than a single economic indicator. The US dollar index is currently trading around 101.10 on the daily chart, with the price continuing to run above the 20-day exponential moving average of 100.19, and the overall short-term structure remains relatively strong. The RSI (14) has risen to 68.36, which is close to the overbought zone of 70, indicating that the bullish momentum is quite obvious, but it also means that the probability of a technical consolidation after further gains in the US dollar is increasing. The first thing to watch below is the 20-day EMA around 100.19, which is an important defensive area for the current short-term bullish structure. If the US dollar index can continue to stabilize above this moving average, the short-term strong pattern may continue; if it falls below 100.19, we need to be wary of a deeper correction in the previous upward trend. The important resistance above is around the previous high of 101.80, and the US dollar index still has room to test the high. However, the RSI approaching the overbought zone means that the momentum for chasing gains may gradually slow down, so the subsequent market is more likely to be driven by US employment, PCE inflation, and changes in the Fed's interest rate expectations. Editor's Summary: The US dollar index has maintained strong fluctuations around the 101 level. This week's US economic data will be the core factor determining its short-term direction. JOLTS, PCE, ADP, and ISM Manufacturing PMI will provide clues about employment and inflation, while the September non-farm payrolls report may be a key point for repricing the Fed's October policy expectations. Meanwhile, oil prices and the situation in the Middle East may still influence the dollar and US interest rate markets through inflation expectations. Technically, the 20-day EMA around 100.19 is an important level to watch for in the short-term bullish structure of the dollar. If the price continues to hold above this level, the market should remain wary of the possibility of further upward fluctuations and strengthening of the dollar at higher levels.
- Risk Warning and Disclaimer
- The market involves risk, and trading may not be suitable for all investors. This article is for reference only and does not constitute personal investment advice, nor does it take into account certain users’ specific investment objectives, financial situation, or other needs. Any investment decisions made based on this information are at your own risk.