After gold fell 3%, the US and Iran responded to Japan by recalculating the premium.
2026-09-29 16:14:15
On Tuesday, September 29th, spot gold was trading around $4140 per ounce. The previous trading day saw significant selling pressure, with the price falling to a low of around $4110 per ounce, a single-day drop of over 3%, and a cumulative pullback of approximately 5% over the past week. The pricing focus has shifted from a purely safe-haven narrative to two simultaneously operating variables: continued contact between the US and Iran through mediators, and verifiable progress on the Strait of Hormuz passage arrangements; and the revaluation of the holding cost of non-interest-bearing assets following rising expectations of a Fed rate hike. Iranian Foreign Minister Araqchi publicly stated that he hopes to receive a formal response from the US to Tehran's proposal on Tuesday. At the same time, some media outlets reported that the US was discussing easing sanctions and unfreezing funds in exchange for progress on its nuclear program, but these claims were subsequently denied. Both sides confirmed that contact is still ongoing through mediators. Gold is currently trading not on slogans, but on how a breakdown or easing of negotiations will rewrite the path of oil prices, inflation expectations, and interest rates. 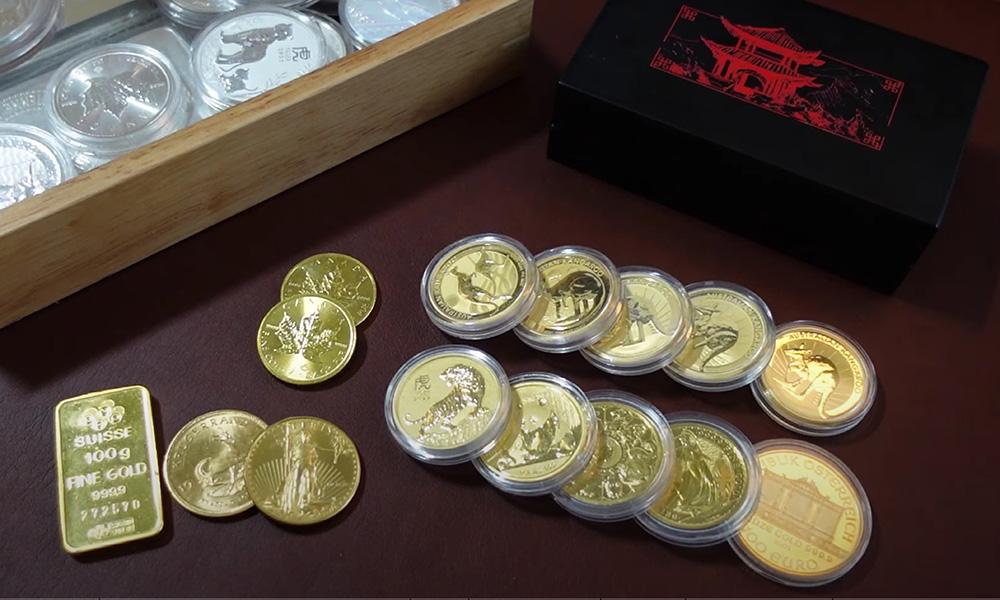
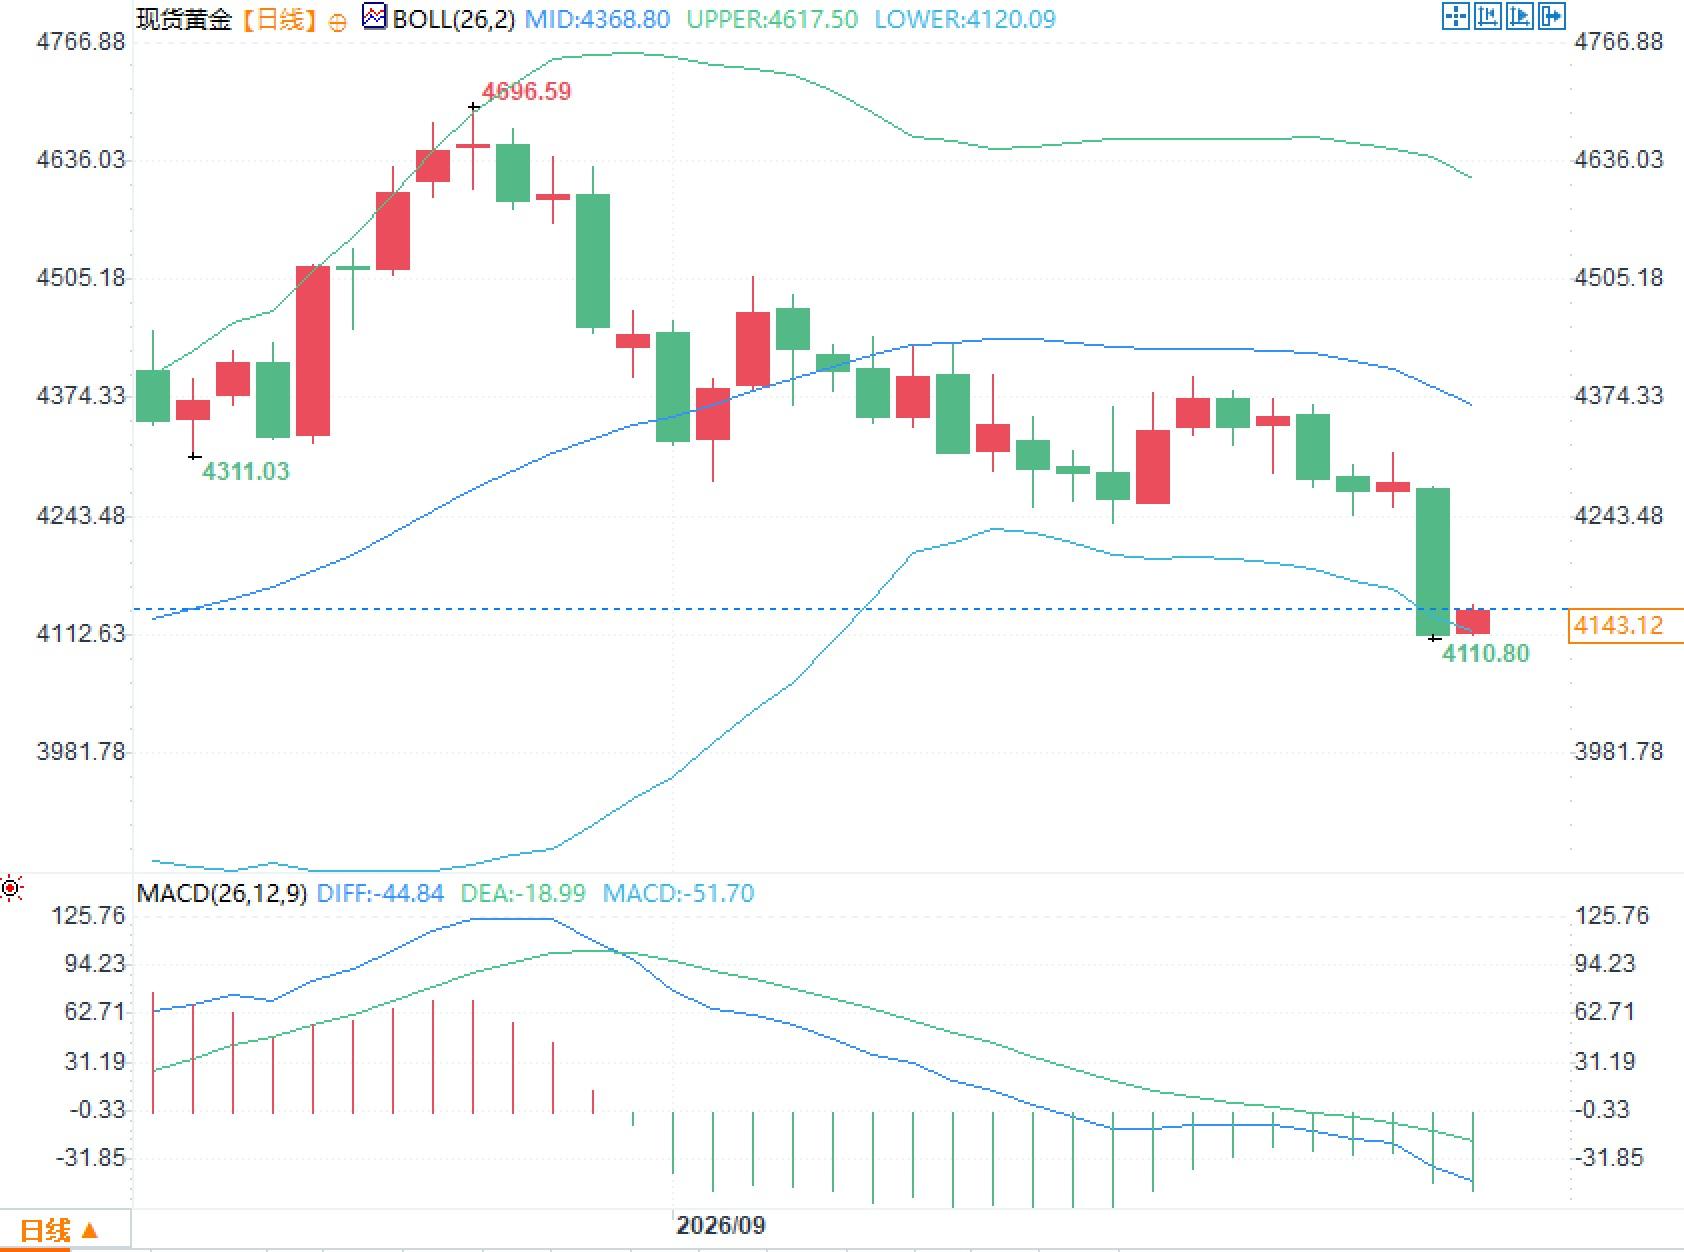 Even more informative are the structural changes. The middle band, after rising, flattened and then declined, indicating that the medium-term average price center is shifting downwards; the price approaching the lower band indicates that the deviation is already high, but high deviation only means that volatility has been amplified, and cannot alone infer the speed of regression. The MACD running below the zero line corresponds to the recent average price being weaker than the longer-term average price, which is a confirmation of the already occurred downward trend. Wide bandwidth and negative momentum mean that news shocks will amplify the amplitude; once there are verifiable changes in cross-strait relations or interest rates, the same indicators will quickly be rewritten.
US-Iran talks bring gold risk premium back to the forefront.
The resilience of spot gold to US-Iran news stems from the Strait of Hormuz's position in global oil transportation, not from any single verbal statement. Blocked passage through the strait directly impacts energy price fluctuations, influencing inflation expectations and subsequently bond yields and dollar-denominated assets. If an enforceable text of the passage arrangement emerges, the market will lower the conflict premium and simultaneously adjust its pricing of subsequent interest rate paths. On Saturday, the US publicly rejected Iran's proposal to reopen the strait as soon as possible. Araghchi subsequently emphasized to the media that Iran had not yet received a formal response from the mediators, stating that it was "prepared for diplomacy and also prepared for a renewed escalation of the conflict; the choice lies with the US." US Secretary of State Rubio stated that reaching an agreement would require lengthy and arduous negotiations, and the nuclear issue must be included in the framework; the mediators would remain involved. The key point of observation on the 29th was therefore very specific: after Araghchi's contact with the Qatari mediators in New York, would the US respond by maintaining the current pace of contact or tightening the conditions again? Reports mentioning easing of sanctions and unfreezing of funds were immediately denied, indicating that the agreement is not yet finalized and the market can only trade probabilities, not outcomes. For gold, the key is not to automatically equate conflict with safe-haven appeal, but whether the three issues—the Straits issue, oil trade, and nuclear talks—will be bundled into a verifiable package within the same week. If it is verifiable, risk premiums and interest rate expectations will be rewritten; if it fails to materialize, the premium will remain on the market in the form of higher volatility.Interest rate repricing is increasing the opportunity cost of holding gold.
Beyond geopolitical clues, gold prices are also digesting the hard constraints of interest rates. Since gold doesn't pay dividends, the cost of holding it will be immediately reflected in positions when real interest rates and short-term policy rates rise. The Federal Reserve raised the target range for the federal funds rate by 25 basis points to 3.75% to 4.00% at its September meeting, with the median of the dot plot pointing to a policy rate of approximately 4.1% by the end of 2026. Based on this, the market traded that there is still a possibility of rate hikes this year. Federal funds futures pricing in another rate hike in October rose to over 70% at one point, the two-year Treasury yield broke through 4.7%, and the 10-year yield touched around 5.23% in the previous trading day. St. Louis Fed President Bullard publicly stated that he hopes the policy rate will remain above 3.25% and is inclined to maintain a restrictive stance for longer than the market expects. Fed Governor Cook warned that rising oil prices and some demand expansion could continue to push up inflation readings in the short term. This information places gold in a narrow pricing mezzanine: the conflict premium remains, but funds are demanding higher compensation for non-interest-bearing assets. If oil prices surge due to news from the Taiwan Strait, inflation expectations will be reignited, potentially pushing interest rate hikes even higher. Conversely, if the Straits arrangement is implemented and oil prices fall, interest rate hikes could be reduced. Both paths would involve adjusting interest rates first, then gold prices, rather than adjusting sentiment first and then interest rates.Daily indicators
From a daily chart perspective, spot gold entered a downward trend after reaching a high of $4696.59/oz. The Bollinger Bands have a middle band at $4368.80/oz, an upper band at $4617.50/oz, and a lower band at $4120.09/oz. The price is trading near the lower band, and the wide band indicates that the volatility has not yet converged to a lower range. The MACD parameters DIFF is -44.84, DEA is -18.99, and the MACD histogram is -51.70. Both the fast and slow lines are below the zero line, and the histogram remains in negative territory. Even more informative are the structural changes. The middle band, after rising, flattened and then declined, indicating that the medium-term average price center is shifting downwards; the price approaching the lower band indicates that the deviation is already high, but high deviation only means that volatility has been amplified, and cannot alone infer the speed of regression. The MACD running below the zero line corresponds to the recent average price being weaker than the longer-term average price, which is a confirmation of the already occurred downward trend. Wide bandwidth and negative momentum mean that news shocks will amplify the amplitude; once there are verifiable changes in cross-strait relations or interest rates, the same indicators will quickly be rewritten.
- Risk Warning and Disclaimer
- The market involves risk, and trading may not be suitable for all investors. This article is for reference only and does not constitute personal investment advice, nor does it take into account certain users’ specific investment objectives, financial situation, or other needs. Any investment decisions made based on this information are at your own risk.