Why did silver's sharp drop on Monday fare worse than gold's?
2026-09-29 17:56:21
On Tuesday, September 29th, spot silver was consolidating narrowly around $60.50 per ounce, slightly stabilizing from the previous trading day's close, but failing to recover from Monday's sharp decline; the gold-silver ratio was approximately 68.3 to 1. This round of repricing was not triggered by a single technical indicator, but rather by the repricing of the Strait of Hormuz's access prospects, which simultaneously rewrote the holding cost of silver due to energy premiums, US Treasury yields, and the Fed's interest rate path. After US President Trump publicly rejected Iran's proposal to reopen the Strait of Hormuz, Brent crude oil briefly climbed back above $100 per barrel, and the 10-year US Treasury yield rose to approximately 5.20% to 5.22%, while the 2-year yield was around 4.90%. The Fed raised the target range for the federal funds rate by 25 basis points last week to 3.75% to 4.00%, and market pricing in another rate hike in October rose to around 70%. As a non-interest-bearing asset, silver in this combination simultaneously bears the inflationary concerns brought about by rising geopolitical premiums and the opportunity cost of rising real interest rates. 
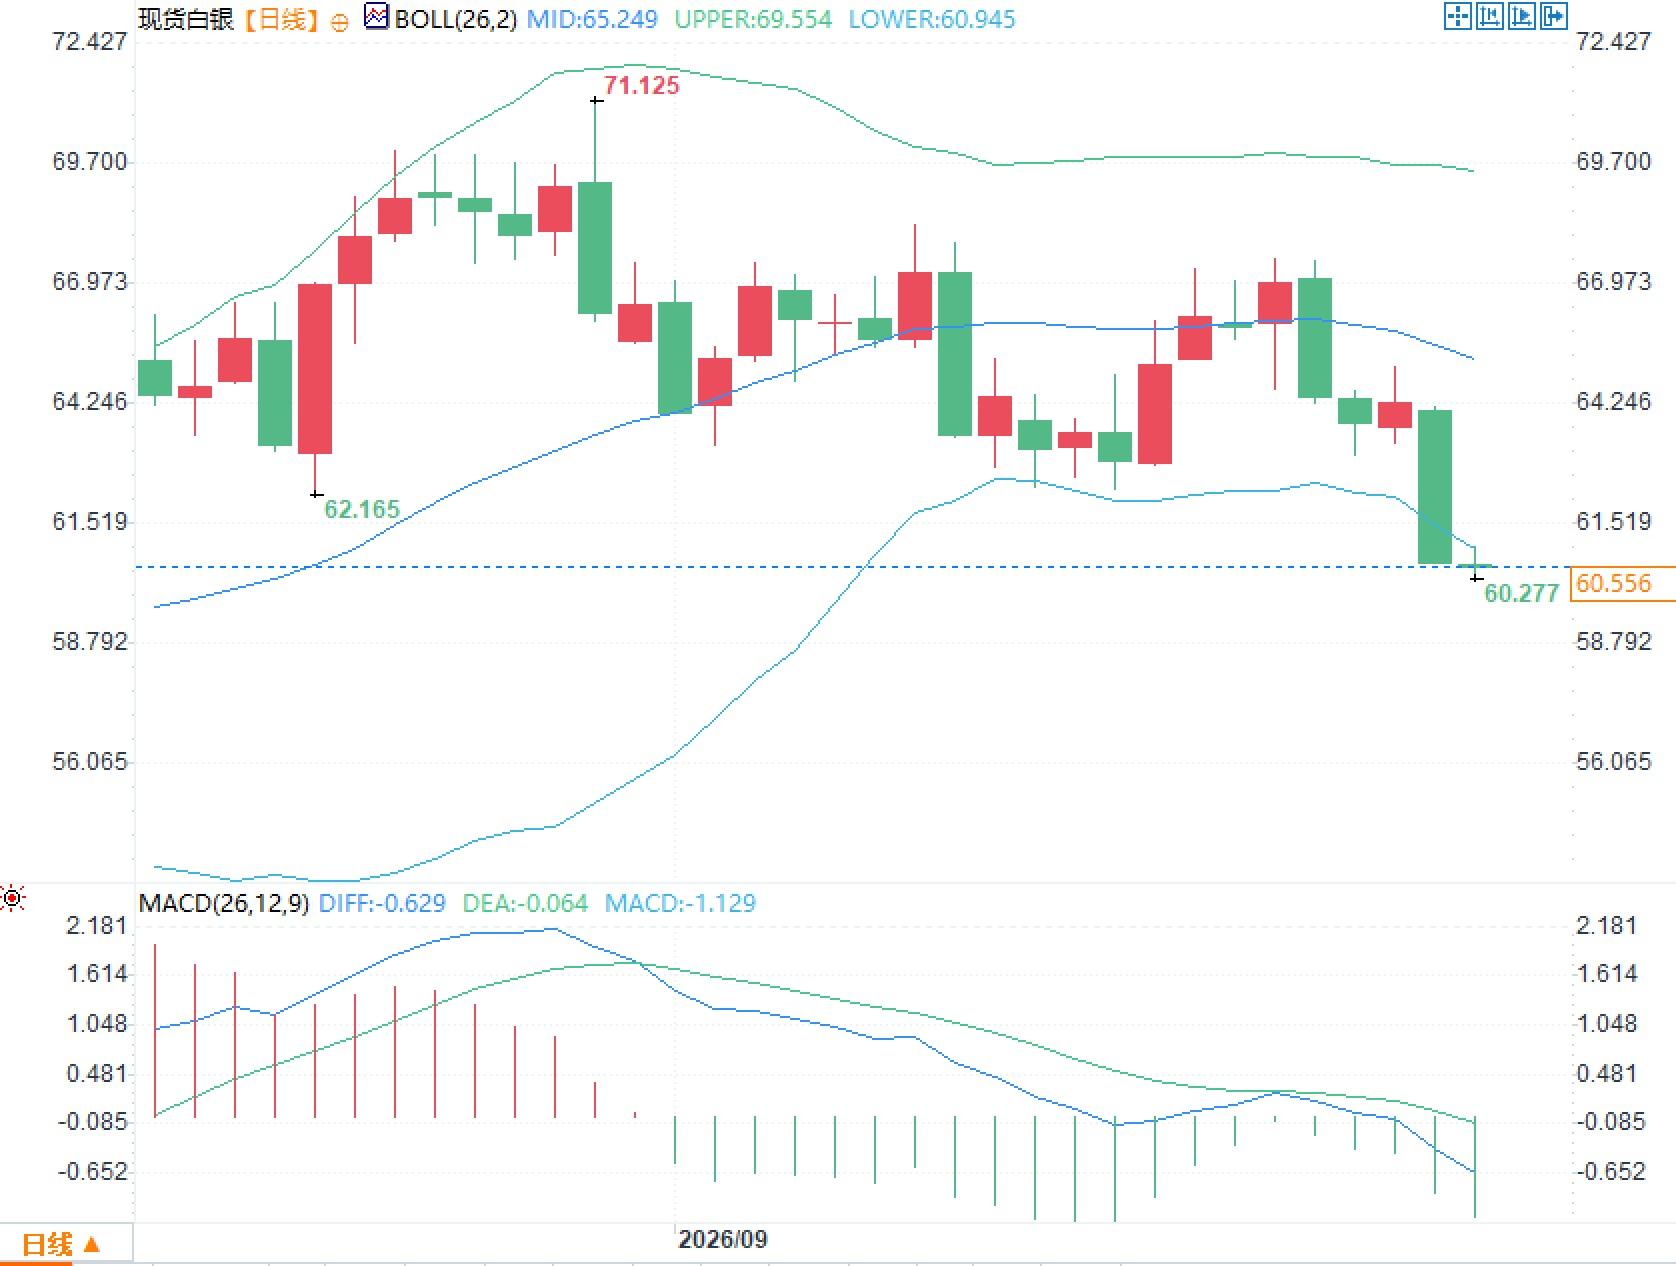 The MACD parameters DIFF is -0.629, DEA is -0.064, and the MACD histogram is -1.129. Both the fast and slow lines are below the zero axis, and the green histogram bars have expanded compared to the previous few days. This indicates that the short-term moving average system is in a weak alignment with the medium-term moving average system, and the momentum divergence has not yet converged. More useful indicators are whether the bandwidth continues to expand, whether the closing price continues to stay outside the lower band, and whether the MACD histogram has changed from divergence to convergence.
How the Hormuz variable rewrites the risk premium for silver
The starting point of this round of fluctuations was a publicly rejected proposal for passage. Iranian Foreign Minister Arajichi had previously proposed a seven-point plan during the UN General Assembly, the core of which was to demand the lifting of port blockades, easing of oil-related restrictions, and access to frozen funds in exchange for the reopening of the Strait of Hormuz and the resumption of nuclear talks. Trump subsequently told the media, "They offered a proposal, but I rejected it." However, the news wasn't completely shut down. Trump denied some media reports that the US had proactively offered sanctions easing and frozen funds, but confirmed that the two sides were still in contact through mediation channels, stating that "there may be more talks this week." Arajichi indicated that Tehran was expected to receive a formal response to the proposal to reopen the strait. What truly changes pricing is not slogans, but whether passage through the strait can be restored within a verifiable timeline. The Strait of Hormuz handles a significant proportion of global seaborne crude oil and liquefied natural gas traffic; obstruction will push energy prices back into inflation expectations; improved expectations will reduce the impact of oil prices on interest rate paths. Silver possesses both safe-haven and industrial properties, making its pricing more sensitive to the strait than to a single precious metal narrative.The triple constraints of interest rates, oil prices, and non-interest-bearing assets
Silver's larger drop than gold on Monday is not based on complex logic. Gold reflects more real interest rates and safe-haven demand, while silver also bears the burden of expected demand from photovoltaics, electronics, and industrial sectors. If the conflict drags on, rising energy costs will increase inflation concerns, leading the market to revise upwards the probability of further Fed rate hikes. Simultaneously, if global manufacturing activity slows due to energy shocks, the industrial demand discount rate for silver will be lowered. The combination of these two forces creates a structure where "safe-haven buying is insufficient to compensate for the industrial discount." Cleveland Fed President Hammark attributed the rise in long-term Treasury yields to the continued resilience of growth and employment, as well as debt supply pressures. Fed Governor Cook warned that rising oil prices and related activities could continue to push up inflation readings in the near term. These statements themselves do not point to a particular trading direction, but together they form the denominator in silver pricing: the higher the nominal interest rate and term premium, the higher the relative cost of holding a non-interest-bearing metal.Daily chart structure
The daily chart for spot silver shows the Bollinger Bands with the middle band at $65.249/oz, the upper band at $69.554/oz, and the lower band at $60.945/oz. After the previous high of $71.125/oz, the price center gradually shifted downwards. The middle band flattened out from an upward trend and then turned downwards, the upper band flattened out, and the lower band initially rose and then slid, with the bandwidth experiencing a process of expansion followed by contraction. The MACD parameters DIFF is -0.629, DEA is -0.064, and the MACD histogram is -1.129. Both the fast and slow lines are below the zero axis, and the green histogram bars have expanded compared to the previous few days. This indicates that the short-term moving average system is in a weak alignment with the medium-term moving average system, and the momentum divergence has not yet converged. More useful indicators are whether the bandwidth continues to expand, whether the closing price continues to stay outside the lower band, and whether the MACD histogram has changed from divergence to convergence.This week's key information: official responses, inflation figures, and employment data.
The following observation windows have varying weights. First, there are the formal responses from both Iran and the US to the Hormuz proposal, and whether the mediators can provide a verifiable timetable. Second, there's the US personal consumption expenditure price index and non-farm payroll data to be released this week, both of which will adjust the probability distribution of the October interest rate decision. Third, there's whether the oil yield curve steepens again and whether the 10-year US Treasury yield continues to remain above 5.20%. Silver's elasticity to these three factors is typically in the order of interest rate expectations, energy premium, and then industrial demand correction. Aragic set "a formal response will be received today" as a short-term anchor. Trump set "contact will continue this week" as another anchor. Both anchors can be valid simultaneously: continued contact does not equate to convergence of conditions. Market analysis suggests that if subsequent actions are merely repetitions of statements without concrete details, volatility may decrease, but the pricing center may not return to last week's level of around $64/ounce. Conversely, if an enforceable Straits arrangement emerges, oil prices and front-end interest rates are often the first to be repriced, with silver only representing a secondary layer.- Risk Warning and Disclaimer
- The market involves risk, and trading may not be suitable for all investors. This article is for reference only and does not constitute personal investment advice, nor does it take into account certain users’ specific investment objectives, financial situation, or other needs. Any investment decisions made based on this information are at your own risk.