Gold Outlook: Spot gold faces significant rebound risk after sharp decline.
2026-09-29 18:50:14
The precious metals market experienced a brutal opening this week, with various precious metals suffering huge declines, representing one of the largest drops in history.  Gold fell over 4%, silver fell over 5%, and platinum and palladium fell nearly 3.5% and 5% respectively. For gold, this was the 88th largest single-day drop since records began in 1968, with other precious metals following suit. US real yields surged to their highest level since 2008. As previously mentioned, the current macroeconomic environment is extremely unfavorable for precious metals: precious metals themselves do not generate interest income, physical holdings incur storage costs, and they are primarily priced in US dollars. The trend of US real yields confirms this. Although in the short term, there is no strong correlation between real yields and gold, a longer-term perspective reveals a significant divergence. The US 10-year real yield, representing the real return investors can expect after deducting the average market inflation expectations for the next ten years, has surged to 2.85%, the highest level since November 2008 and the 22nd highest single-day closing price in history since 2003. This round of upward movement has been extremely rapid: already at historical highs, the real yield has risen another 51 basis points in the past 20 trading days. The macroeconomic environment remains bearish, but gold is already extremely oversold. Even though the signals from US Treasury Inflation-Protected Securities (TIPS) may be somewhat affected by the legacy effects of the Fed's past quantitative easing, it's difficult to draw a bullish fundamental conclusion about precious metals (or even broader risk assets) given such high risk-free real yields. For gold, the question is straightforward: when investors can obtain a real yield of nearly 3% from US Treasury bonds, how can gold, as a traditional safe-haven asset, compete, given its lack of interest income and dollar-denominated price? Understanding this makes it easier to understand why gold is struggling in the current environment. Six similar historical price movements provide a reference for the future market. The sharp sell-off in gold does indeed have a solid fundamental logic behind it. However, macroeconomic fundamentals are one thing, and prices entering an extremely oversold state is another. Currently, there are no catalytic signals to alleviate the downward pressure on the precious metals market, but historical experience tells us that a strong counter-trend rebound is not entirely impossible. On the four-hour chart for gold, the 14-period Relative Strength Index (RSI) has reached extreme oversold levels, and the ATR-50 is also in extreme territory, with the latest closing price trading below the lower Bollinger Band. Reviewing historical charts reveals that similar technical conditions have often been followed by significant rebounds in gold prices. To avoid relying solely on subjective visual judgment, this article backtests historical data on price performance after similar oversold conditions.
 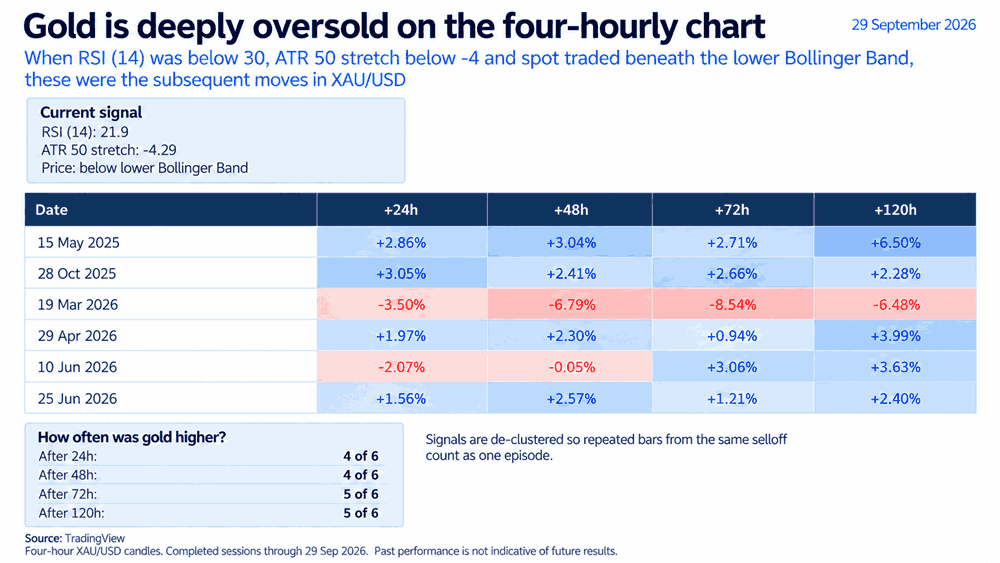 The backtesting used fixed and simple screening criteria: on a four-hour timeframe, the 14-period RSI was below 30, the ATR-50 stretch indicator was below -4, and the gold price was trading below the lower Bollinger Band. Based on this standard, there have been six independent similar price action scenarios in history. In four of these six scenarios, the gold price rose after 24 hours; in four of these scenarios, it rose after 48 hours; and in five of these scenarios, it rose after 72 hours and 120 hours. The only significant exception occurred in March of this year: at that time, selling pressure continued to release, and the gold price continued to decline. Each round of large-scale selling has its own unique background, and that particular scenario was quite special: gold had previously experienced an extremely frenzied speculative surge in modern markets, reaching a high of $5,500 per ounce, before the bubble burst and a decline began. This case also serves as a warning that historical patterns do not necessarily repeat themselves. However, overall, there is still a possibility that the gold price could experience a short-term rebound within the context of a downward trend. $4115 becomes the first critical line between bulls and bears. Monday's sharp drop was extremely strong, breaking through multiple support levels. Gold prices are currently struggling just above the support level of $4115 per ounce.
 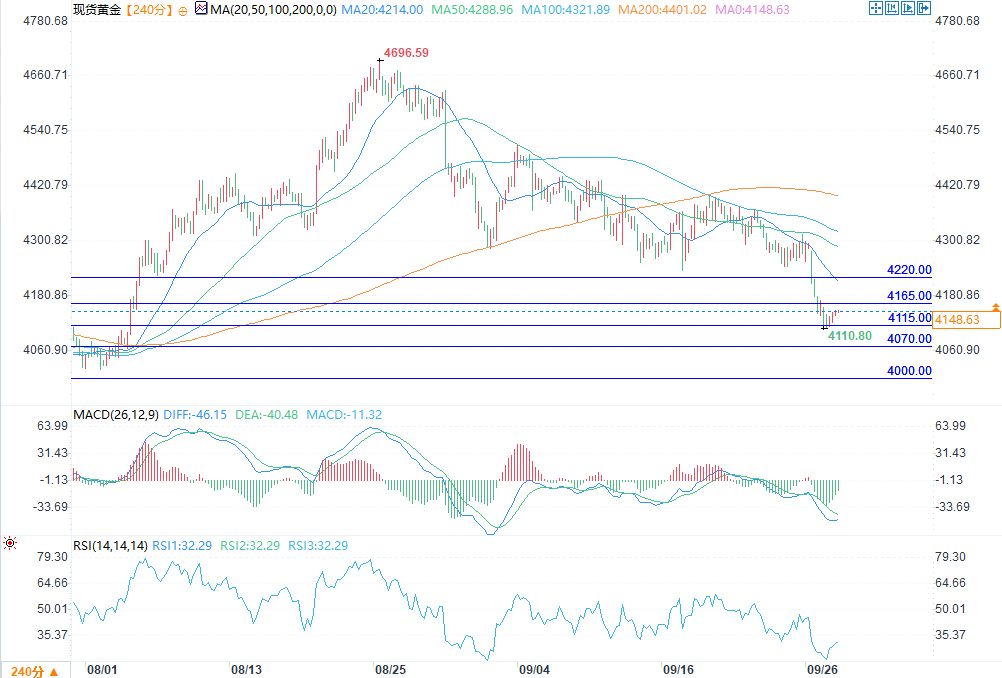 (Spot gold 4-hour chart source: FX678) This price level has now become the most crucial key level for gold traders. If the downtrend continues, the next key downside target is $4070/oz, a level that acted as both resistance and support in late July and early August this year. Further down, a stronger support zone lies below $4000: the upper limit of this zone is the low of $3996 formed at the end of July, and the lower limit is the low of $3943 from earlier this year. Conversely, if gold prices rebound from $4115, they are likely to first challenge the high of $4165 formed at the end of July this year, with the next key resistance level at $4220. For a rebound to hold above $4220, significant macroeconomic news is often needed to at least partially offset the downward pressure on precious metals from rising US Treasury yields and a stronger dollar.
Gold fell over 4%, silver fell over 5%, and platinum and palladium fell nearly 3.5% and 5% respectively. For gold, this was the 88th largest single-day drop since records began in 1968, with other precious metals following suit. US real yields surged to their highest level since 2008. As previously mentioned, the current macroeconomic environment is extremely unfavorable for precious metals: precious metals themselves do not generate interest income, physical holdings incur storage costs, and they are primarily priced in US dollars. The trend of US real yields confirms this. Although in the short term, there is no strong correlation between real yields and gold, a longer-term perspective reveals a significant divergence. The US 10-year real yield, representing the real return investors can expect after deducting the average market inflation expectations for the next ten years, has surged to 2.85%, the highest level since November 2008 and the 22nd highest single-day closing price in history since 2003. This round of upward movement has been extremely rapid: already at historical highs, the real yield has risen another 51 basis points in the past 20 trading days. The macroeconomic environment remains bearish, but gold is already extremely oversold. Even though the signals from US Treasury Inflation-Protected Securities (TIPS) may be somewhat affected by the legacy effects of the Fed's past quantitative easing, it's difficult to draw a bullish fundamental conclusion about precious metals (or even broader risk assets) given such high risk-free real yields. For gold, the question is straightforward: when investors can obtain a real yield of nearly 3% from US Treasury bonds, how can gold, as a traditional safe-haven asset, compete, given its lack of interest income and dollar-denominated price? Understanding this makes it easier to understand why gold is struggling in the current environment. Six similar historical price movements provide a reference for the future market. The sharp sell-off in gold does indeed have a solid fundamental logic behind it. However, macroeconomic fundamentals are one thing, and prices entering an extremely oversold state is another. Currently, there are no catalytic signals to alleviate the downward pressure on the precious metals market, but historical experience tells us that a strong counter-trend rebound is not entirely impossible. On the four-hour chart for gold, the 14-period Relative Strength Index (RSI) has reached extreme oversold levels, and the ATR-50 is also in extreme territory, with the latest closing price trading below the lower Bollinger Band. Reviewing historical charts reveals that similar technical conditions have often been followed by significant rebounds in gold prices. To avoid relying solely on subjective visual judgment, this article backtests historical data on price performance after similar oversold conditions. The backtesting used fixed and simple screening criteria: on a four-hour timeframe, the 14-period RSI was below 30, the ATR-50 stretch indicator was below -4, and the gold price was trading below the lower Bollinger Band. Based on this standard, there have been six independent similar price action scenarios in history. In four of these six scenarios, the gold price rose after 24 hours; in four of these scenarios, it rose after 48 hours; and in five of these scenarios, it rose after 72 hours and 120 hours. The only significant exception occurred in March of this year: at that time, selling pressure continued to release, and the gold price continued to decline. Each round of large-scale selling has its own unique background, and that particular scenario was quite special: gold had previously experienced an extremely frenzied speculative surge in modern markets, reaching a high of $5,500 per ounce, before the bubble burst and a decline began. This case also serves as a warning that historical patterns do not necessarily repeat themselves. However, overall, there is still a possibility that the gold price could experience a short-term rebound within the context of a downward trend. $4115 becomes the first critical line between bulls and bears. Monday's sharp drop was extremely strong, breaking through multiple support levels. Gold prices are currently struggling just above the support level of $4115 per ounce. (Spot gold 4-hour chart source: FX678) This price level has now become the most crucial key level for gold traders. If the downtrend continues, the next key downside target is $4070/oz, a level that acted as both resistance and support in late July and early August this year. Further down, a stronger support zone lies below $4000: the upper limit of this zone is the low of $3996 formed at the end of July, and the lower limit is the low of $3943 from earlier this year. Conversely, if gold prices rebound from $4115, they are likely to first challenge the high of $4165 formed at the end of July this year, with the next key resistance level at $4220. For a rebound to hold above $4220, significant macroeconomic news is often needed to at least partially offset the downward pressure on precious metals from rising US Treasury yields and a stronger dollar.
- Risk Warning and Disclaimer
- The market involves risk, and trading may not be suitable for all investors. This article is for reference only and does not constitute personal investment advice, nor does it take into account certain users’ specific investment objectives, financial situation, or other needs. Any investment decisions made based on this information are at your own risk.