Gold prices rose as cooling PCE inflation reduced the probability of a Fed rate hike in October.
2026-09-30 21:56:19
On Wednesday (September 30) during the early US trading session, spot gold prices strengthened, while spot silver prices weakened slightly. Cooling US inflation data eased pressure on the Federal Reserve to immediately tighten monetary policy, but high US Treasury yields and a still-strong dollar limited the upside potential for precious metals. Spot gold traded around $4184.55 per ounce, up 0.07% on the day; spot silver was at $60.974, down 0.79%.  US August Personal Consumption Expenditures (PCE) data was released, showing an overall PCE increase of 0.3% month-over-month and 3.4% year-over-year; core PCE increased by 0.2% month-over-month and 3.0% year-over-year. Personal income rose 0.2% month-over-month, disposable income increased by 0.3%, and household consumption expenditure surged by 0.9%. The data indicates that even with resilient end-user demand, inflation has cooled. Strong ADP private sector employment data has shifted market focus to the non-farm payrolls report due at 8:30 AM ET on Friday, which will be the next key signal for assessing the Fed's interest rate path. Prior to the inflation data release, the market's implied probability of a Fed rate hike in October fell to a low of 40%, compared to around 70% earlier this week; meanwhile, the 10-year Treasury yield remained around 5.2%. The decline in inflation has lowered expectations of a rate hike, which is positive for gold, but the resilience of household consumption and strong private sector employment data have limited the upside potential for gold. While the Strait of Hormuz and the US-Iran situation remain unresolved, the resumption of crude oil exports from the Gulf region has eased immediate pressure on the oil market. Gulf oil-producing countries are circumventing the blockade by using shuttle tankers, ship-to-ship transshipment, and the Saudi East-West pipeline, bringing Middle Eastern crude oil shipments back to their highest levels since the outbreak of the Iranian conflict. West Texas Intermediate (WTI) crude is trading around $91 per barrel, while Brent crude is near $98.63 per barrel. Although oil prices remain high enough to factor energy inflation into the Federal Reserve's policy considerations, they have moved away from the peak that triggered the precious metals sell-off on Monday. Oil prices have a two-way impact on gold: a decline in crude oil prices will weaken the inflationary momentum pushing up US Treasury yields and the dollar; however, the continued stalemate in negotiations and lingering shipping risks provide safe-haven buying support for gold. Global market risk appetite diverged before the US stock market opened. US stock index futures weakened, with S&P 500 futures down 0.1%, Dow Jones futures down 0.2%, and Nasdaq futures down 0.3%, as high US Treasury yields continue to suppress stock valuations. European stocks were mixed, with French and German stocks declining and British stocks closing slightly higher; Asian stocks mostly recorded gains. The US dollar weakened slightly against the yen and euro, providing support for gold prices, but US Treasury yields remained high, making it difficult for precious metals to recover the major upward trend lost on Monday. Other major overseas markets: WTI crude oil on the New York Mercantile Exchange rose to $91 per barrel; Brent crude oil was at $98.63 per barrel. The yield on the benchmark 10-year US Treasury note remained around 5.258%. The US dollar index retreated from its two-month high reached on Tuesday. Gold Technical Analysis
 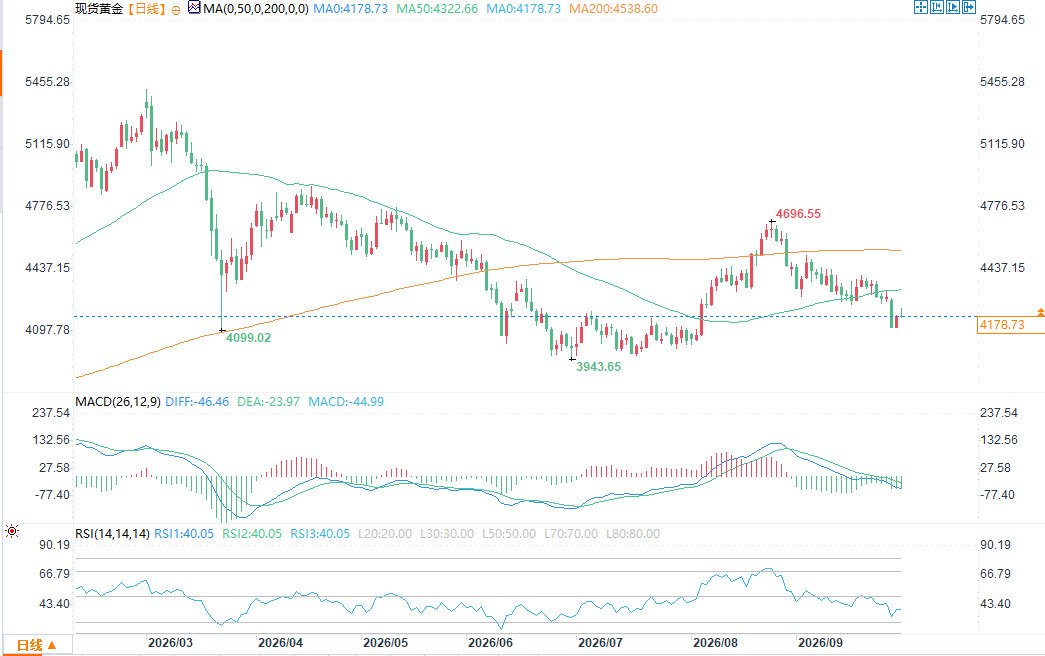 The next upside target for bulls is to push gold prices above the $4210.63-$4222.11 resistance zone. A successful break above this level would target $4238.00, followed by $4254.44. The short-term bearish target is to break below $4162.06, with subsequent support at $4136.44, and then the $4000-$4020 range. First resistance level: $4210.63; second resistance level: $4222.11; first support level: $4162.06; second support level: $4136.44. Silver Technical Analysis
 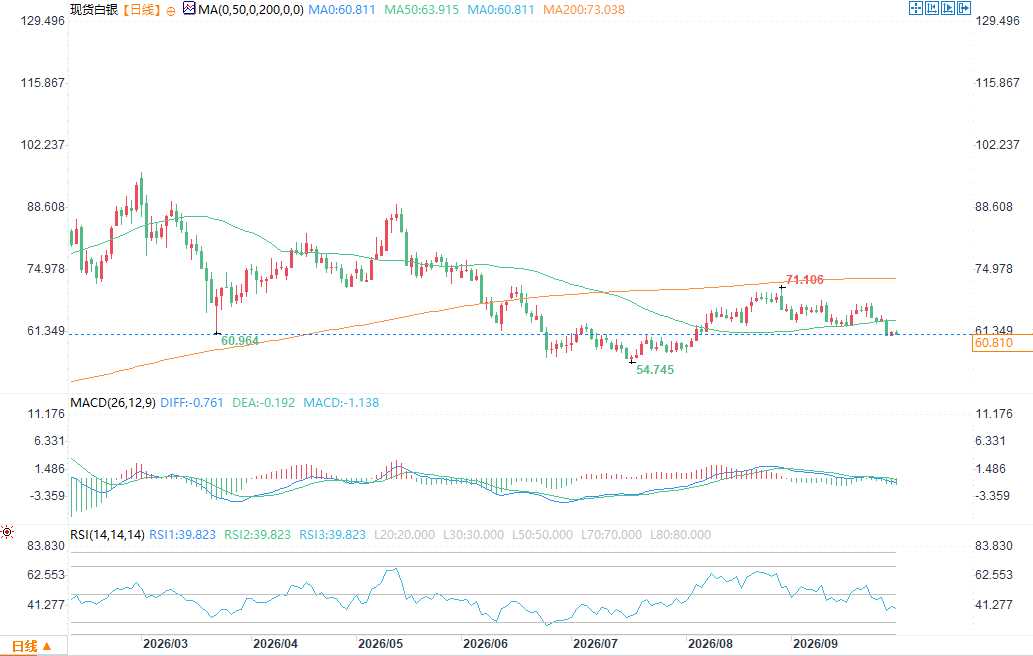 Silver bulls need to push prices back above the $62.069-$62.834 range. A break above this level would target the 50-day moving average around $63.890, followed by $64.080. Bears, on the other hand, would target a break below $60.639, then $59.706, with a deeper target in the $56-$57 range. First resistance is at $62.069, second resistance at $62.834; first support is at $60.639, second support at $59.706.
US August Personal Consumption Expenditures (PCE) data was released, showing an overall PCE increase of 0.3% month-over-month and 3.4% year-over-year; core PCE increased by 0.2% month-over-month and 3.0% year-over-year. Personal income rose 0.2% month-over-month, disposable income increased by 0.3%, and household consumption expenditure surged by 0.9%. The data indicates that even with resilient end-user demand, inflation has cooled. Strong ADP private sector employment data has shifted market focus to the non-farm payrolls report due at 8:30 AM ET on Friday, which will be the next key signal for assessing the Fed's interest rate path. Prior to the inflation data release, the market's implied probability of a Fed rate hike in October fell to a low of 40%, compared to around 70% earlier this week; meanwhile, the 10-year Treasury yield remained around 5.2%. The decline in inflation has lowered expectations of a rate hike, which is positive for gold, but the resilience of household consumption and strong private sector employment data have limited the upside potential for gold. While the Strait of Hormuz and the US-Iran situation remain unresolved, the resumption of crude oil exports from the Gulf region has eased immediate pressure on the oil market. Gulf oil-producing countries are circumventing the blockade by using shuttle tankers, ship-to-ship transshipment, and the Saudi East-West pipeline, bringing Middle Eastern crude oil shipments back to their highest levels since the outbreak of the Iranian conflict. West Texas Intermediate (WTI) crude is trading around $91 per barrel, while Brent crude is near $98.63 per barrel. Although oil prices remain high enough to factor energy inflation into the Federal Reserve's policy considerations, they have moved away from the peak that triggered the precious metals sell-off on Monday. Oil prices have a two-way impact on gold: a decline in crude oil prices will weaken the inflationary momentum pushing up US Treasury yields and the dollar; however, the continued stalemate in negotiations and lingering shipping risks provide safe-haven buying support for gold. Global market risk appetite diverged before the US stock market opened. US stock index futures weakened, with S&P 500 futures down 0.1%, Dow Jones futures down 0.2%, and Nasdaq futures down 0.3%, as high US Treasury yields continue to suppress stock valuations. European stocks were mixed, with French and German stocks declining and British stocks closing slightly higher; Asian stocks mostly recorded gains. The US dollar weakened slightly against the yen and euro, providing support for gold prices, but US Treasury yields remained high, making it difficult for precious metals to recover the major upward trend lost on Monday. Other major overseas markets: WTI crude oil on the New York Mercantile Exchange rose to $91 per barrel; Brent crude oil was at $98.63 per barrel. The yield on the benchmark 10-year US Treasury note remained around 5.258%. The US dollar index retreated from its two-month high reached on Tuesday. Gold Technical Analysis The next upside target for bulls is to push gold prices above the $4210.63-$4222.11 resistance zone. A successful break above this level would target $4238.00, followed by $4254.44. The short-term bearish target is to break below $4162.06, with subsequent support at $4136.44, and then the $4000-$4020 range. First resistance level: $4210.63; second resistance level: $4222.11; first support level: $4162.06; second support level: $4136.44. Silver Technical Analysis Silver bulls need to push prices back above the $62.069-$62.834 range. A break above this level would target the 50-day moving average around $63.890, followed by $64.080. Bears, on the other hand, would target a break below $60.639, then $59.706, with a deeper target in the $56-$57 range. First resistance is at $62.069, second resistance at $62.834; first support is at $60.639, second support at $59.706.
- Risk Warning and Disclaimer
- The market involves risk, and trading may not be suitable for all investors. This article is for reference only and does not constitute personal investment advice, nor does it take into account certain users’ specific investment objectives, financial situation, or other needs. Any investment decisions made based on this information are at your own risk.