Why do long-term interest rates remain high despite the US core PCE falling to 3.0%?
2026-10-01 22:00:18
On Thursday, October 1st, the US dollar index rose to around 101.80 during the session; the yield on the 10-year US Treasury note briefly touched 5.342%, before falling back to around 5.279%. Meanwhile, the US August PCE price index rose 3.4% year-on-year, core PCE rose 3.0% year-on-year, and the core indicators rose 0.2% month-on-month. This set of signals is not singular: inflation is slowing marginally, but long-term interest rates remain high, and Federal Reserve officials have differing opinions on the pace of further tightening. Therefore, dollar pricing reflects the combined effect of three clues: policy endpoint, term premium, and data resilience. 
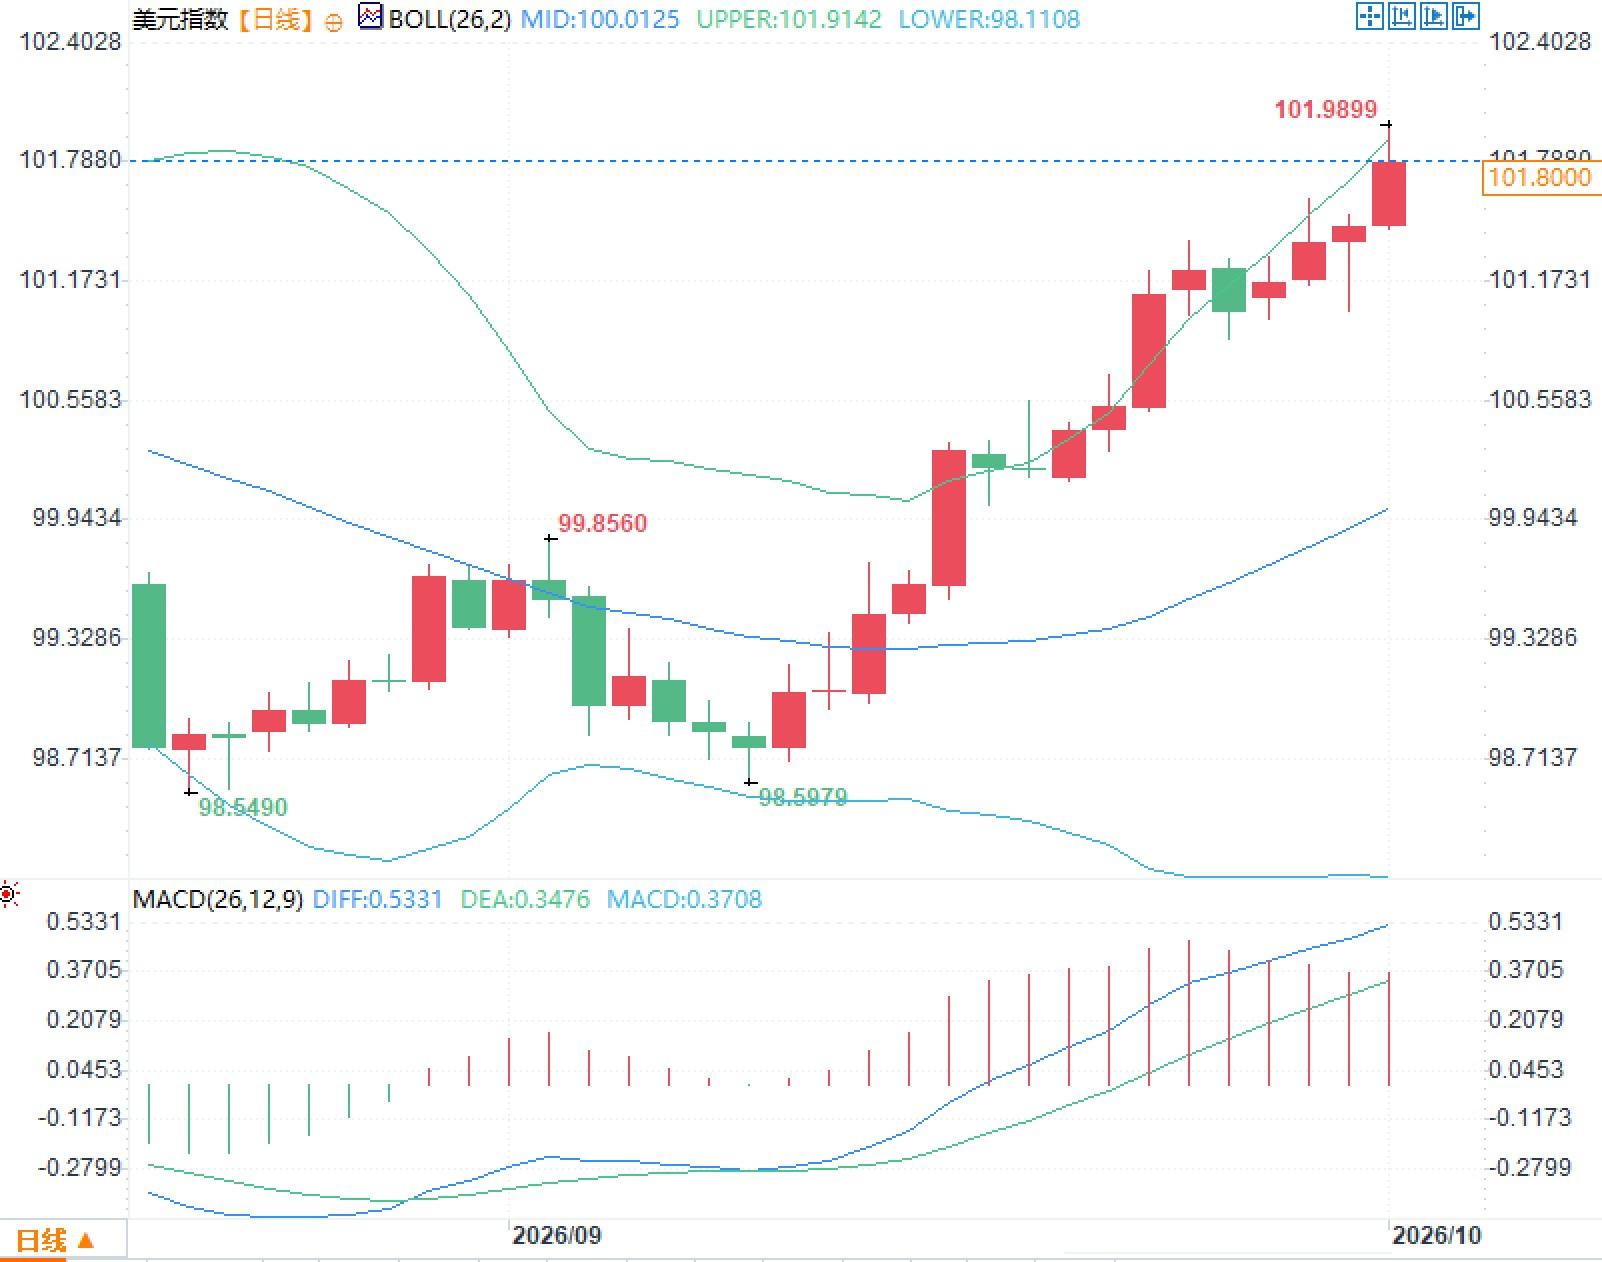 For the US dollar index, it is more informative to observe the Bollinger Bands, MACD, yield curve, policy expectations, and the degree of surprise in macroeconomic data in tandem, so as to avoid replacing macroeconomic pricing logic with a single technical indicator.
The Fed's policy focus: Uncertainty surrounding the final interest rate re-enters pricing.
On September 16, the Federal Reserve raised the target range for the federal funds rate by 25 basis points to 3.75%-4.00% by a 12-0 vote. The latest economic projections indicate a median federal funds rate of 4.1% at the end of 2026, higher than the current target range midpoint; the median core PCE forecast for 2026 is 3.4%, also significantly higher than the long-term inflation target of 2%. This means the core of the policy discussion is no longer just whether to continue tightening, but how long it will take for restrictive financial conditions to absorb the persistent inflation. Kashkari stated on October 1 that the Fed will take necessary measures to push inflation back to its target, but he explicitly stated that he did not know how high interest rates would ultimately need to rise. His focus is not on a single supply shock, but on the possibility that consecutive years of supply shocks could make price pressures more persistent. Williams previously emphasized that further rate hikes were not urgent. These two statements do not represent opposing policy objectives, but rather different weights given to the persistence of inflation, the time lag in policy transmission, and the costs of further tightening. Current market pricing indicates that the implied probability of the Federal Reserve raising interest rates again in October is about 40%, a significant decrease from previous estimates.With both inflation cooling and consumption remaining resilient, long-term interest rates have become a key variable.
US core PCE rose 0.2% month-over-month and 3.0% year-over-year in August, but personal consumption expenditures rose 0.9% month-over-month, real personal consumption expenditures rose 0.6% month-over-month, and personal income rose 0.2% month-over-month. This means that while price pressures have eased somewhat, demand has not slowed significantly in tandem. Therefore, improved core inflation cannot be directly equated with a rapid easing of financial conditions. More noteworthy is the long-term yield. The 10-year US Treasury yield touched 5.342% intraday on October 1st, and although it subsequently retreated, it remains at multi-year highs. Its pricing reflects not only the Fed's policy rate expectations but also term premiums, bond supply, energy prices, and long-term inflation risk compensation. Therefore, the current dollar index cannot be explained solely by short-term interest rate spreads; long-term financing costs and cross-asset fund reallocation also have significant explanatory power.US Dollar Index Technical Structure: Trend Expansion and Volatility Rising Simultaneously
The daily chart shows the Bollinger Band middle line at approximately 100.0125 and the upper line at approximately 101.9142, with the price currently near the upper Bollinger Band. The MACD indicator shows the DIFF at 0.5331 and the DEA at 0.3476, with the histogram remaining positive. This combination reflects a widening deviation of the price from its recent average, along with increased trend strength and volatility. For the US dollar index, it is more informative to observe the Bollinger Bands, MACD, yield curve, policy expectations, and the degree of surprise in macroeconomic data in tandem, so as to avoid replacing macroeconomic pricing logic with a single technical indicator.The market will next focus on the cross-validation of data and policies.
The most important short-term validation variables remain employment and inflation. The US September jobs report will be released on October 2nd, the September CPI on October 14th, and the next Federal Reserve policy meeting is scheduled for October 27th-28th. What the market truly needs to determine is not whether any single data point is too high or too low, but whether employment, wages, service prices, energy costs, and financial conditions are all following a consistent inflationary path. If subsequent data continue to diverge, the importance of policy communication will increase accordingly. The US dollar index, short-term interest rates, and long-term yields could very well trigger different degrees of repricing of the same data; this difference in asset reactions is itself a key characteristic of the current macroeconomic environment.Frequently Asked Questions
Question 1: The US core PCE fell to 3.0% year-on-year, so why is the US dollar index still at a high level? Answer: Foreign exchange pricing reflects inflation, interest rate differentials, long-term yields, and risk premiums simultaneously. The core PCE rose only 0.2% month-on-month in August, but the 10-year US Treasury yield remains at a multi-year high, and the Fed has not ruled out the possibility of another rate adjustment this year. Improvement in inflation alone is insufficient to independently drive exchange rates. Especially during periods of rising term premiums, the dollar's sensitivity to changes in long-term yields also increases. Question 2: Do Fed officials Kashkari and Williams represent completely opposite policy directions? Answer: No. Both discussed policy around the 2% inflation target; the main difference lies in the pace. Kashkari emphasizes that continuous supply shocks may solidify inflation, while Williams emphasizes that existing tightening needs time to transmit. Therefore, the market is focused on when adjustments will be made, not whether the policy target has changed.- Risk Warning and Disclaimer
- The market involves risk, and trading may not be suitable for all investors. This article is for reference only and does not constitute personal investment advice, nor does it take into account certain users’ specific investment objectives, financial situation, or other needs. Any investment decisions made based on this information are at your own risk.