Gold prices traded sideways as a stronger dollar offset the impact of waning expectations for a Fed rate hike.
2026-10-06 00:42:18
On Monday (October 5), spot gold lacked clear directional momentum. A stronger dollar and persistently high US Treasury yields weighed on gold prices, while cooling market expectations for a Fed rate hike provided downward support. Spot gold traded at $4128.02, down 0.30%.  The latest US business survey data failed to provide new directional guidance for gold. The S&P Global Services Purchasing Managers' Index (PMI) for September was revised slightly upward to 58.8 from the preliminary reading of 58.7, while the composite PMI remained unchanged at 58.4. In contrast, the US Institute for Supply Management (ISM) Services PMI fell to 54.9 from 55.4, slightly below the market expectation of 55.0. Prior to this data release, Friday's employment report fell short of expectations: US non-farm payrolls increased by only 29,000 in September, far below the market expectation of 90,000; the combined employment figures for the previous two months were revised downward by 60,000, the unemployment rate rose slightly to 4.2%, and year-on-year wage growth slowed to 3.0%. Previously, August's Personal Consumption Expenditures (PCE) inflation data also fell short of expectations, and previous data were revised downward. The weakening of both employment and inflation reduced market expectations for another interest rate hike by the Federal Reserve at its October 27-28 policy meeting. According to the CME FedWatch Tool, traders are currently pricing in only about a 20% probability of an October rate hike, compared to nearly 70% last week. However, policymakers are concerned that inflation remains above the 2% target, coupled with the ongoing Middle East situation increasing the risk of energy inflation, and the overall monetary policy outlook remains biased towards further tightening. This limits the upside potential for gold and provides support for the dollar and US Treasury yields. Deutsche Bank economists stated, "Despite the dismal non-farm payroll data, the overall labor market remains resilient, as evidenced by the ADP employment data and initial jobless claims. Based on this, we still expect the Fed to raise rates twice more in the next two quarters, each by 25 basis points." The economists added, "Following the release of the non-farm payroll data, Fed officials' speeches largely continued the quarterly rate hike pace implied by the September dot plot. Even with the weaker-than-expected non-farm payrolls, our assessment of the Fed's policy path has not changed significantly." The ongoing political and fiscal problems in France, leading to a significant weakening of the euro, also provided support for the dollar. The US dollar index touched a daily high of 102.53 (its highest since April 2025) before retreating to around 102.20. Meanwhile, the benchmark yield on the 10-year US Treasury note remained around 5.30%, after surging to 5.34% last week, a new high since 2002. A stronger dollar makes gold more expensive for overseas buyers; higher yields increase the opportunity cost of holding gold, a non-interest-bearing asset. Looking ahead, the market will focus on the minutes of the September Federal Open Market Committee (FOMC) meeting released on Wednesday, initial jobless claims data on Thursday, and the preliminary University of Michigan consumer sentiment and inflation expectations data on Friday. Technical analysis: Bulls struggle to break through the $4200 level.
 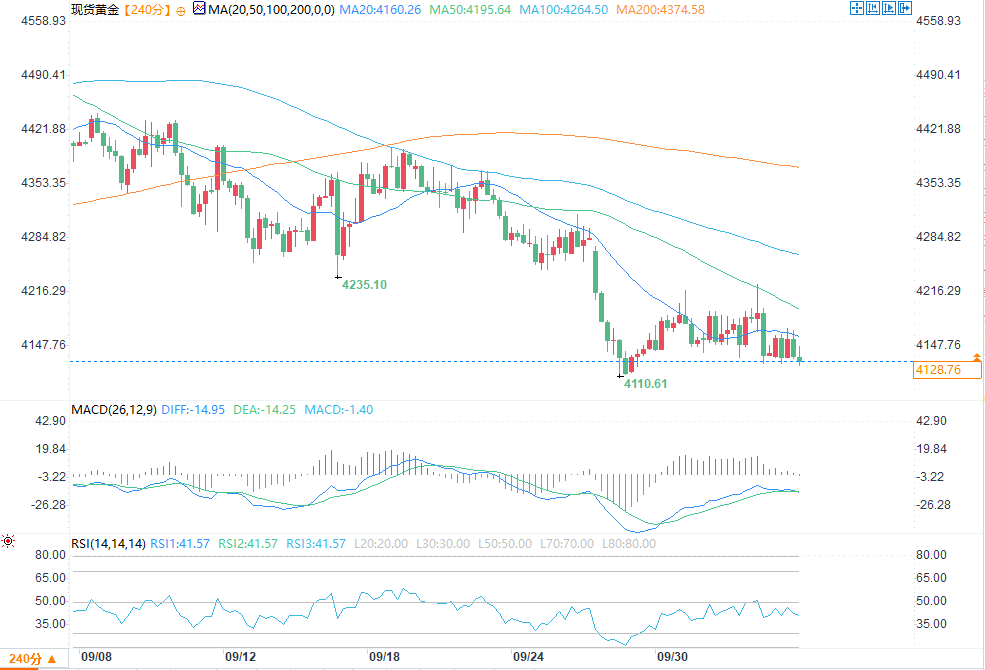 (Spot Gold 4-Hour Chart Source: FX678) On the 4-hour chart, spot gold is consolidating below all major moving averages, indicating a short-term bearish bias. Bulls are struggling to hold the psychological and technical level around 4160, a level very close to the 50-period moving average (4195.64), forming the first strong resistance level in the short term. If the price can break through the current consolidation range and hold above the 50-period moving average, the first upside target is the 100-period moving average at 4264.50; further resistance lies at the 200-period moving average at 4374.58. Only a successful hold above the 100 and 200-period moving averages can confirm the current bullish recovery. The RSI (14) reading is currently 41.57, hovering in the 40-50 range, not yet reaching 46, reflecting a neutral to weak market momentum and limited upward momentum for the bulls. The MACD indicator shows DIFF=-14.95, DEA=-14.25, and the MACD histogram value is -1.40, all below the zero line, not slightly above it, indicating that although gold prices have attempted a slight rebound, the bears still dominate, and the recovery is limited. On the downside, the previous low of 4110.61 is the first key support level, followed by the psychological level of $4100. If the price breaks below the 4110-4100 support level, it will trigger further selling, increasing bearish pressure, with the next support level to be the $4000-$3950 range.
The latest US business survey data failed to provide new directional guidance for gold. The S&P Global Services Purchasing Managers' Index (PMI) for September was revised slightly upward to 58.8 from the preliminary reading of 58.7, while the composite PMI remained unchanged at 58.4. In contrast, the US Institute for Supply Management (ISM) Services PMI fell to 54.9 from 55.4, slightly below the market expectation of 55.0. Prior to this data release, Friday's employment report fell short of expectations: US non-farm payrolls increased by only 29,000 in September, far below the market expectation of 90,000; the combined employment figures for the previous two months were revised downward by 60,000, the unemployment rate rose slightly to 4.2%, and year-on-year wage growth slowed to 3.0%. Previously, August's Personal Consumption Expenditures (PCE) inflation data also fell short of expectations, and previous data were revised downward. The weakening of both employment and inflation reduced market expectations for another interest rate hike by the Federal Reserve at its October 27-28 policy meeting. According to the CME FedWatch Tool, traders are currently pricing in only about a 20% probability of an October rate hike, compared to nearly 70% last week. However, policymakers are concerned that inflation remains above the 2% target, coupled with the ongoing Middle East situation increasing the risk of energy inflation, and the overall monetary policy outlook remains biased towards further tightening. This limits the upside potential for gold and provides support for the dollar and US Treasury yields. Deutsche Bank economists stated, "Despite the dismal non-farm payroll data, the overall labor market remains resilient, as evidenced by the ADP employment data and initial jobless claims. Based on this, we still expect the Fed to raise rates twice more in the next two quarters, each by 25 basis points." The economists added, "Following the release of the non-farm payroll data, Fed officials' speeches largely continued the quarterly rate hike pace implied by the September dot plot. Even with the weaker-than-expected non-farm payrolls, our assessment of the Fed's policy path has not changed significantly." The ongoing political and fiscal problems in France, leading to a significant weakening of the euro, also provided support for the dollar. The US dollar index touched a daily high of 102.53 (its highest since April 2025) before retreating to around 102.20. Meanwhile, the benchmark yield on the 10-year US Treasury note remained around 5.30%, after surging to 5.34% last week, a new high since 2002. A stronger dollar makes gold more expensive for overseas buyers; higher yields increase the opportunity cost of holding gold, a non-interest-bearing asset. Looking ahead, the market will focus on the minutes of the September Federal Open Market Committee (FOMC) meeting released on Wednesday, initial jobless claims data on Thursday, and the preliminary University of Michigan consumer sentiment and inflation expectations data on Friday. Technical analysis: Bulls struggle to break through the $4200 level. (Spot Gold 4-Hour Chart Source: FX678) On the 4-hour chart, spot gold is consolidating below all major moving averages, indicating a short-term bearish bias. Bulls are struggling to hold the psychological and technical level around 4160, a level very close to the 50-period moving average (4195.64), forming the first strong resistance level in the short term. If the price can break through the current consolidation range and hold above the 50-period moving average, the first upside target is the 100-period moving average at 4264.50; further resistance lies at the 200-period moving average at 4374.58. Only a successful hold above the 100 and 200-period moving averages can confirm the current bullish recovery. The RSI (14) reading is currently 41.57, hovering in the 40-50 range, not yet reaching 46, reflecting a neutral to weak market momentum and limited upward momentum for the bulls. The MACD indicator shows DIFF=-14.95, DEA=-14.25, and the MACD histogram value is -1.40, all below the zero line, not slightly above it, indicating that although gold prices have attempted a slight rebound, the bears still dominate, and the recovery is limited. On the downside, the previous low of 4110.61 is the first key support level, followed by the psychological level of $4100. If the price breaks below the 4110-4100 support level, it will trigger further selling, increasing bearish pressure, with the next support level to be the $4000-$3950 range.
- Risk Warning and Disclaimer
- The market involves risk, and trading may not be suitable for all investors. This article is for reference only and does not constitute personal investment advice, nor does it take into account certain users’ specific investment objectives, financial situation, or other needs. Any investment decisions made based on this information are at your own risk.