Credit Market Perspective: This Oil Crisis Is Unique
2026-10-06 01:54:17
The US-Iran conflict has lasted for seven months. This crisis lacks historical precedents, and while oil price movements are similar to past geopolitical crises, other market performances have diverged. US Treasury yields have risen significantly, while credit spreads have remained stable. This difference stems primarily from two factors: first, the US economy's dependence on oil has decreased significantly compared to previous energy crises, mitigating the negative macroeconomic impact of rising oil prices; second, the investment cycle in artificial intelligence supports growth expectations, boosting market risk appetite. Currently, there are signs of supply recovery, with Persian Gulf crude oil exports returning to 80-90% of pre-conflict levels. Influenced by past industry cycles, the number of US drilling rigs is only growing slowly. However, risks have not been eliminated. Bottlenecks remain in the refining and refined product markets, and coupled with the continued uncertainty of the geopolitical situation, policymakers will still face the dual pressures of economic slowdown and rising inflation should the energy market experience further turmoil.  This conflict triggered a global energy supply shock, and to this day, the energy market remains the biggest source of uncertainty for risky assets. As shown in Figure 1, the price of West Texas Intermediate (WTI) crude oil futures for June has risen by about 25% from its level at the end of February, a trend largely similar to past geopolitical oil shocks. Figure 1: Oil Market Performance Similar to Historical Supply Shocks
 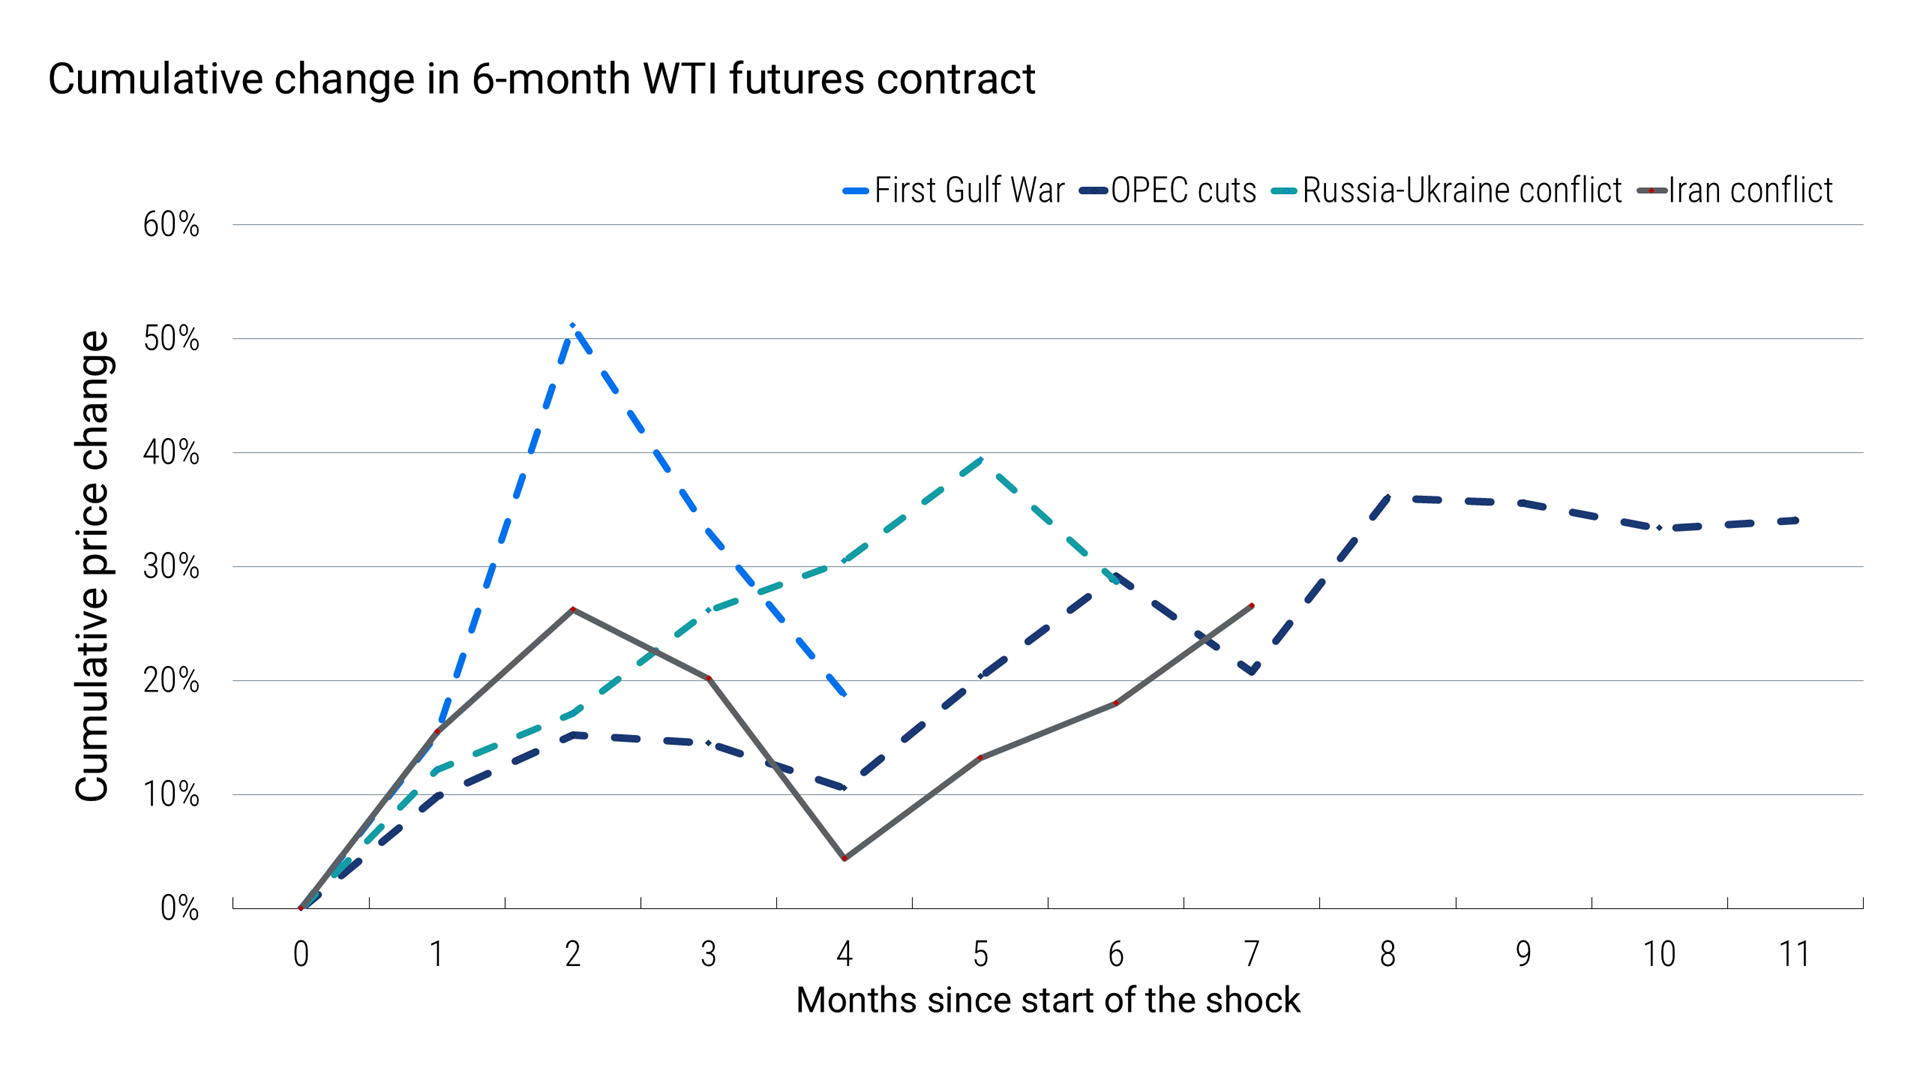 The June futures contract for West Texas Intermediate (WTI) crude oil is often abbreviated as CL6. However, the performance of other major asset classes has not replicated the classic trajectory of historical supply shocks. Figure 2 shows that investment-grade credit spreads are essentially flat compared to February. Figure 3 shows that US Treasury yields will rise significantly in 2026, with a trend more similar to the period of the Russia-Ukraine conflict in 2022 than the first Gulf War in 1991. Rising energy prices have led many investors to expect further interest rate hikes by central banks, which is the core driver of rising real yields. For credit market investors, although credit spreads remain narrow, rising Treasury yields have pushed up total bond yields, which has supported market demand to some extent. Figure 2: US investment-grade credit spreads are essentially flat compared to before the Iran conflict.
 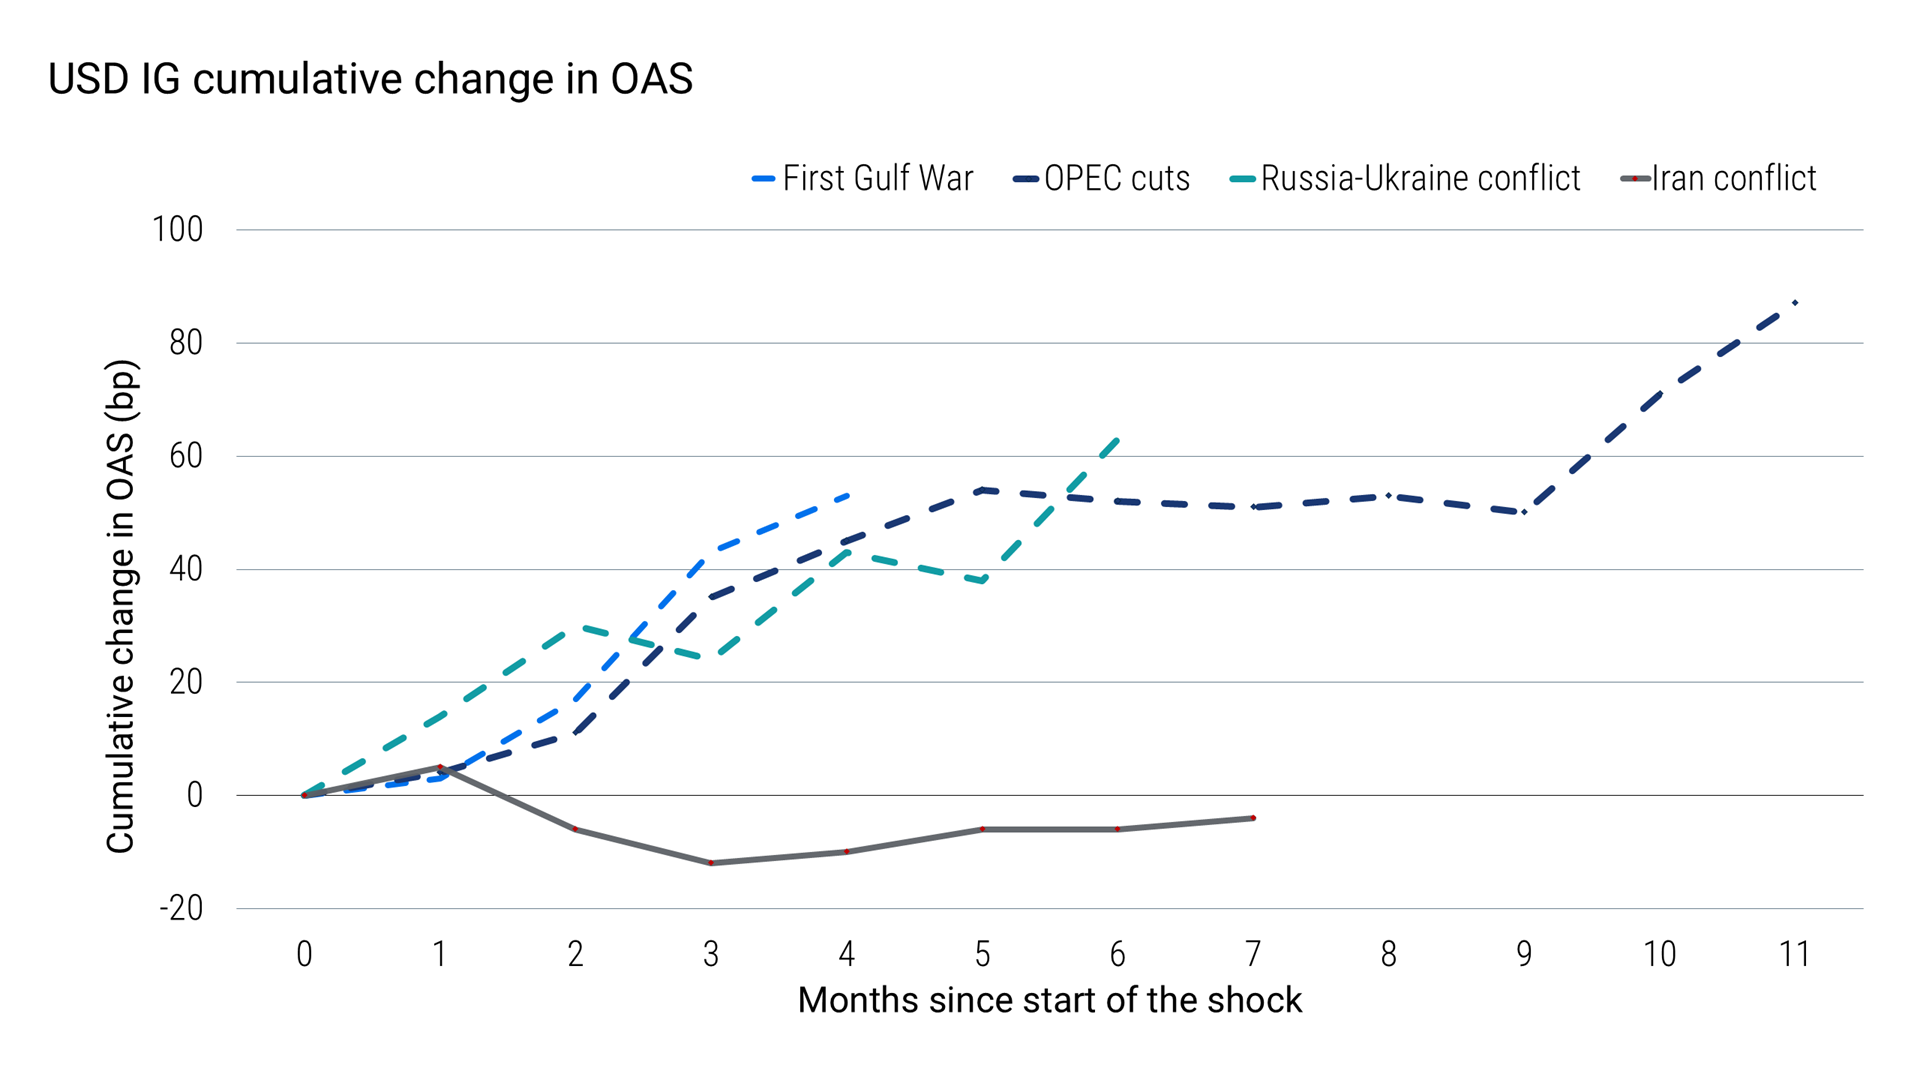 Investment-grade bonds are represented by the Bloomberg U.S. Corporate Dollar Total Return Index. Figure 3: Since the outbreak of the Iran conflict, U.S. Treasury yields have continued to rise.
 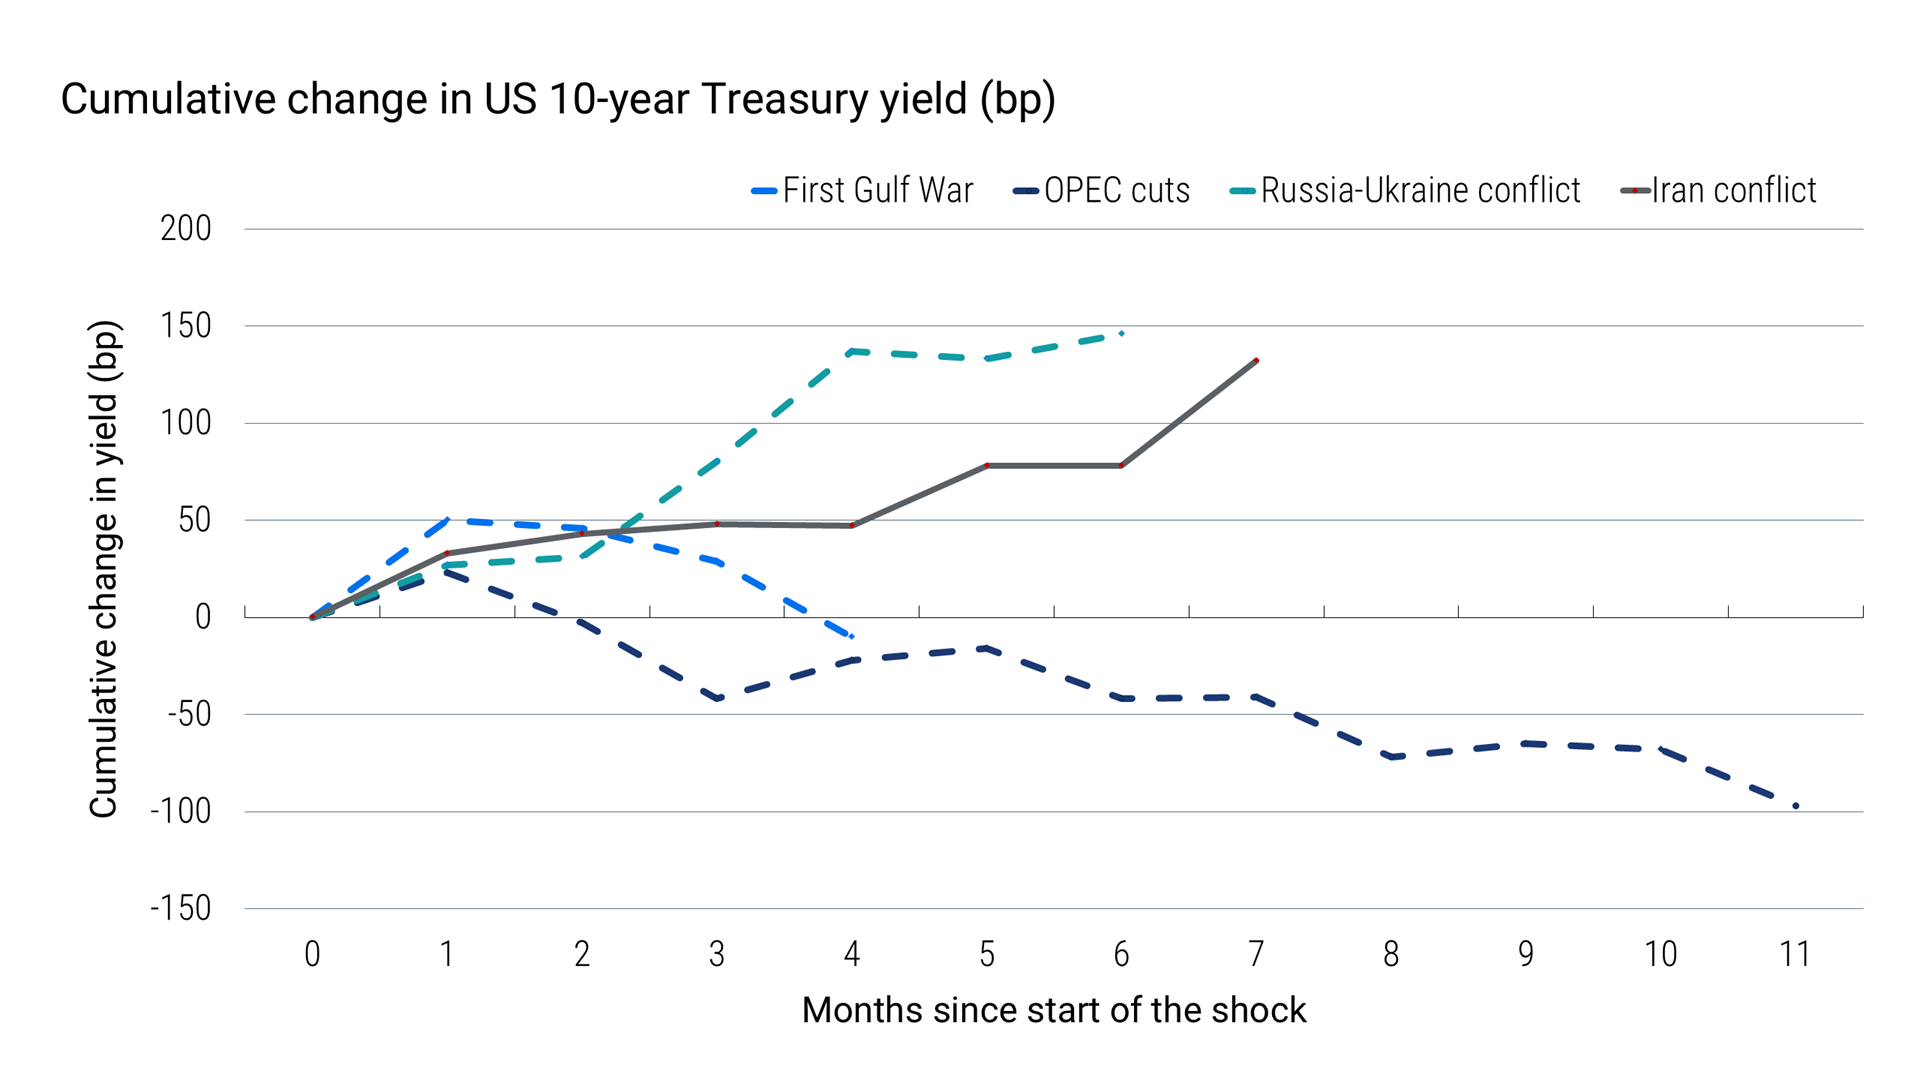 While the interest rate fluctuations at the beginning of the 2022 Russia-Ukraine conflict might seem like a useful framework for understanding the current conflict, traditional macroeconomic logic offers a different conclusion. Historically, energy supply shocks often evolve from inflation panics to growth panics: investors eventually chase safe-haven assets, driving yields down (see Figure 3 again). 2022 was an exception due to its unique economic starting point. During the 2020 pandemic, policy rates in most countries were lowered to near zero; central banks launched large-scale asset purchases, pushing long-term yields to multi-decade lows; simultaneously, massive fiscal stimulus boosted aggregate demand, but encountered supply chain bottlenecks, ultimately causing inflation to soar. At the outset of the current Iranian conflict, none of these conditions existed. Why is this shock different? We believe two core factors have supported the resilience of the US economy so far this year in the face of energy shocks. The first is the intensity of the economy's oil consumption. Figure 4 shows that since the 1980s, the number of barrels of crude oil consumed per unit of output generated by US real GDP has shown a sustained structural decline. Figure 4: Since the 1980s, the oil consumption intensity of the US economy has shown a structural downward trend.
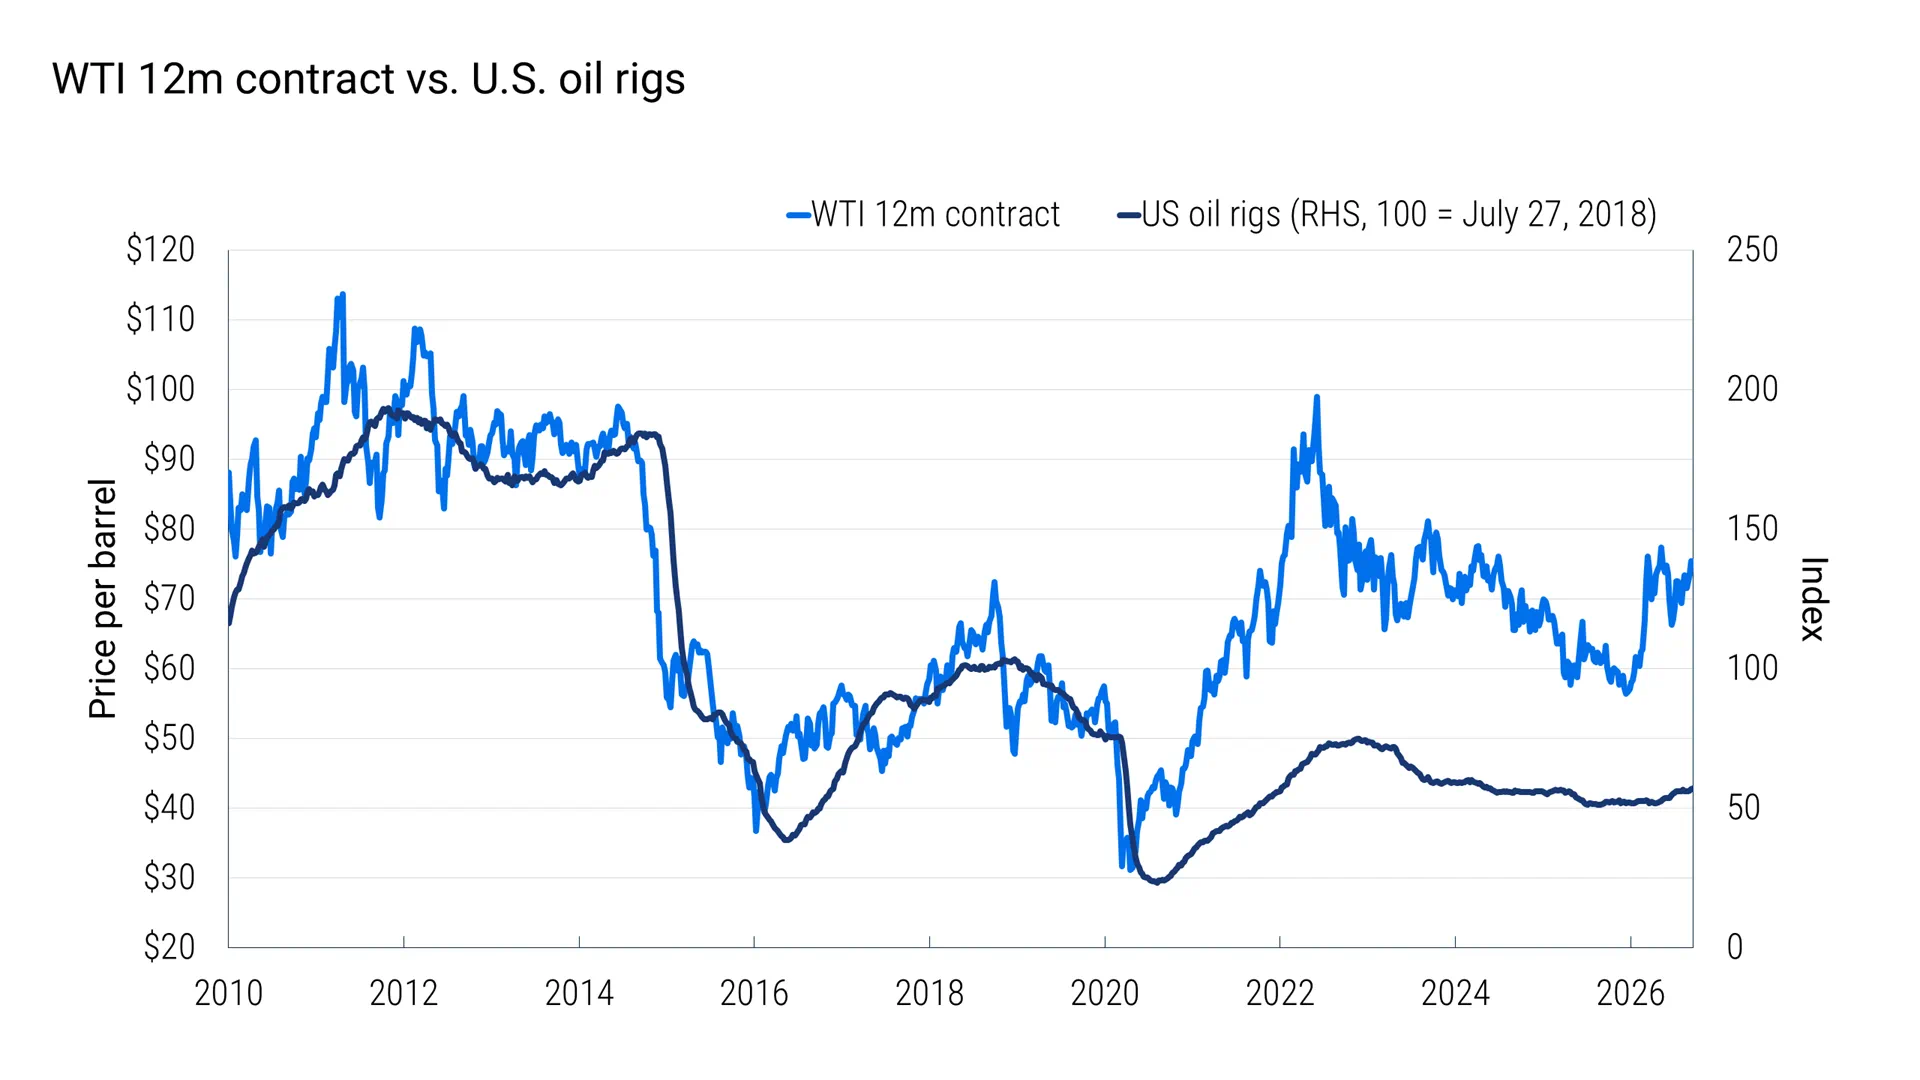
 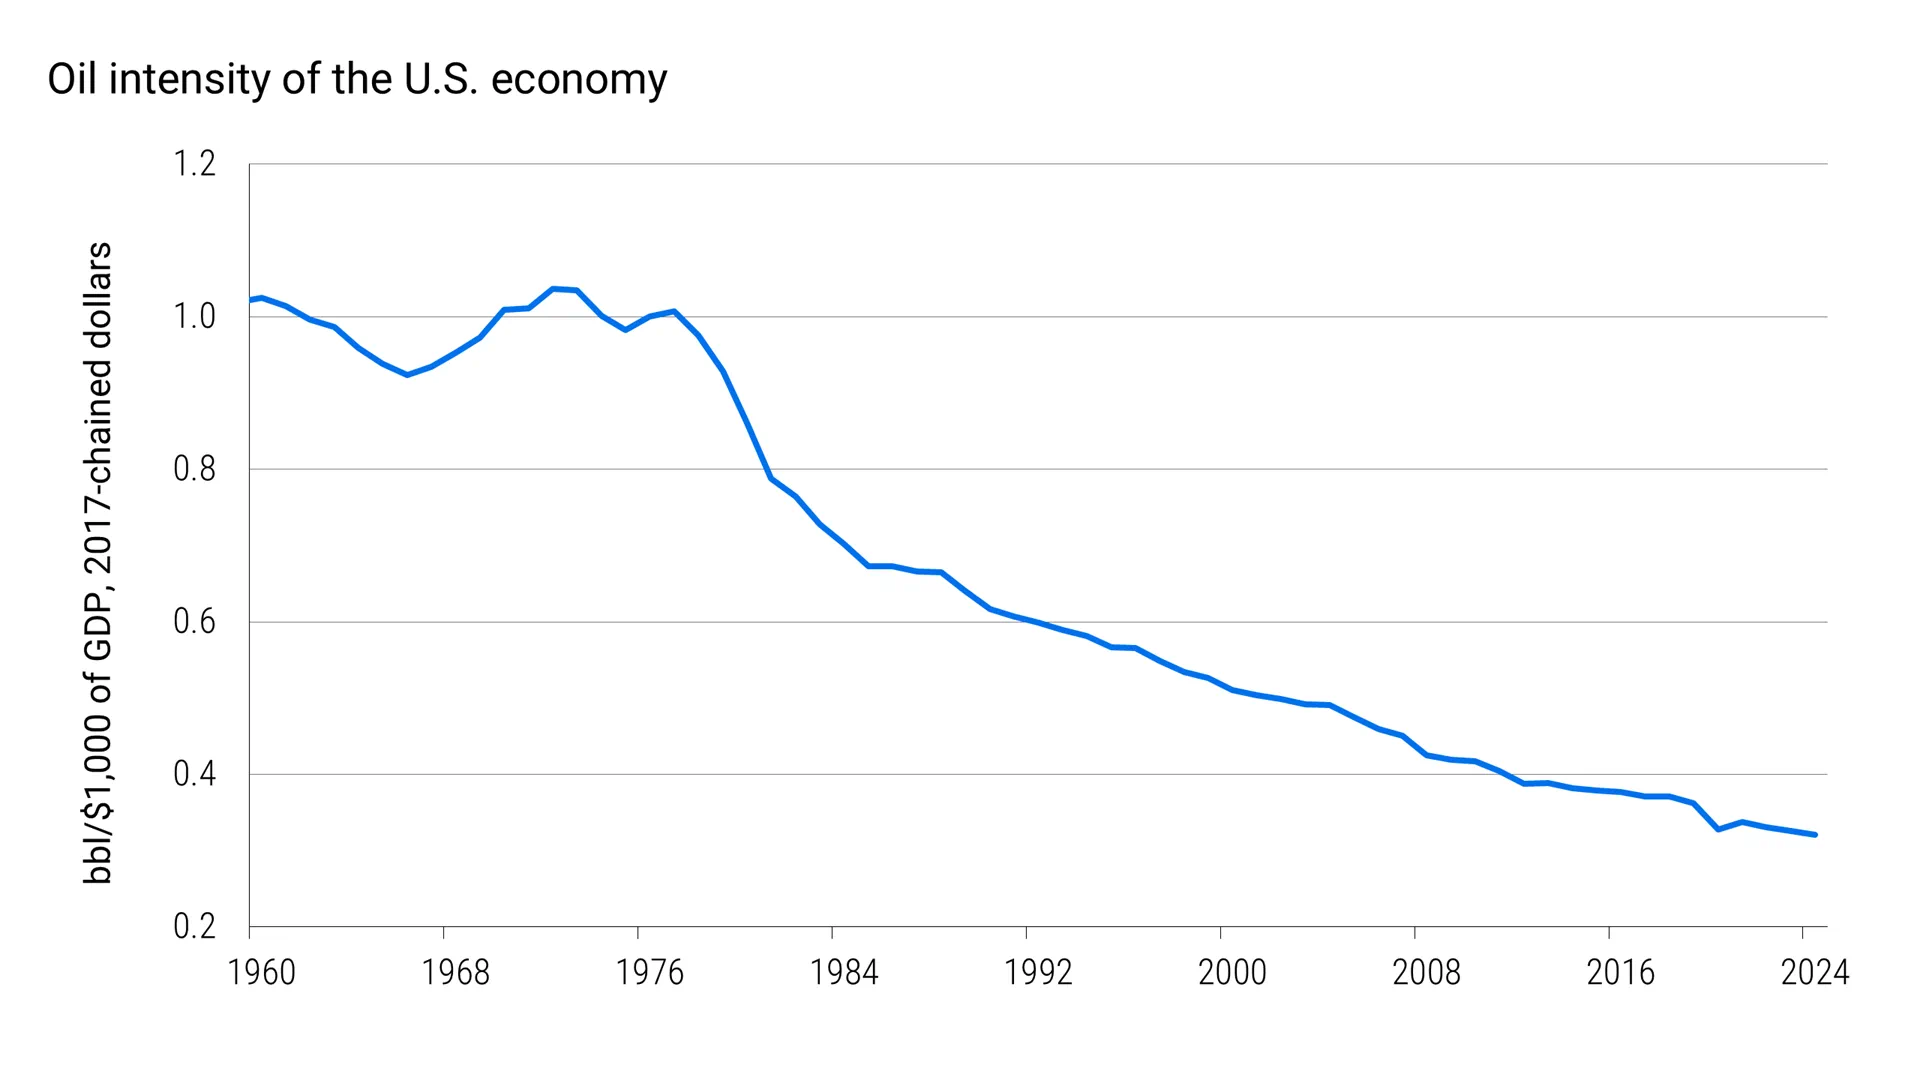 The annual data is updated to 2024, and the data acquisition date is September 30, 2026. Oil consumption intensity measures the amount of oil consumed to generate GDP. For reference, during the first Gulf War in 1991, the US consumed approximately twice the amount of oil needed to generate the same level of GDP as it does today. To put it another way: over the past 50 years, the US has transformed from a manufacturing-led economy to a service-led economy, and the service sector is naturally less sensitive to oil as a production factor. This does not mean that the US is completely unaffected by soaring energy prices. Rather, it means that to replicate the economic slowdown of periods like the first Gulf War, a more intense and longer-lasting energy shock would be needed. The second factor comes from the artificial intelligence investment cycle. In recent months, market expectations for capital expenditures related to the AI ecosystem have continued to rise. Bloomberg's consensus analyst forecast shows that capital expenditures by AI megacities alone may exceed $1 trillion by 2027. Such a scale of capital expenditure has stabilized market expectations for economic growth, boosted risk appetite, and to some extent curbed the transmission of high energy prices to a wider range of risky assets. Supply-side pressures are showing initial signs of easing. Meanwhile, we are observing some positive signals: Persian Gulf crude oil circulation is gradually converging towards the 2025 average. Commodity analyst assessments, news reports, and satellite tracking data indicate that crude oil exports may have recovered to 80%-90% of pre-Iranian conflict levels in recent weeks. Considering the shipping disruptions in the Strait of Hormuz and the Bab el-Mandeb Strait, this recovery level is considerable. Even so, crude oil inventories remain under pressure, and a full return to normal supply still faces significant risks. Furthermore, the increase in the number of drilling rigs suggests that US crude oil production may gradually rise, but at a moderate pace. Baker Hughes statistics show that the number of active drilling rigs in the US will increase by 10% so far in 2026, currently around 600, close to the level at the beginning of 2025 (see Figure 5). However, looking back at the history of the boom-and-bust US energy industry, this round of expansion by oil and gas exploration and production companies is more cautious; compared to before the 2020 pandemic, companies are no longer as responsive to oil price fluctuations. Figure 5: The number of active oil drilling rigs in the United States will increase slightly in 2026 (year-to-date).
  Risks Requiring Close Monitoring While the US economy is currently showing resilience and Gulf oil shipping is showing positive signs, and our baseline scenario suggests that energy prices may gradually decline according to the pricing logic of the futures market, the subsequent path remains fraught with risks. Bottlenecks in the refining sector and the refined oil market are real; the transmission of energy shocks to the real economy depends not only on crude oil prices, but also on diesel, jet fuel, and gasoline prices. Even if crude oil circulation is close to recovery, high energy costs still pose a risk of suppressing consumer spending and overall economic activity. More importantly, the geopolitical situation remains highly volatile. If the crude oil or refined oil markets suffer another supply disruption, the combination of growth and inflation will worsen, and policymakers will face the dilemma of simultaneously weakening the economy and rising inflation. In short, if disruptions to the oil and refined oil supply chain continue, growth expectations and risk assets will become increasingly vulnerable to shocks; however, this round of adjustment may take longer than in previous cycles. The current divergence between various asset classes, contrary to historical patterns, will not last forever.
This conflict triggered a global energy supply shock, and to this day, the energy market remains the biggest source of uncertainty for risky assets. As shown in Figure 1, the price of West Texas Intermediate (WTI) crude oil futures for June has risen by about 25% from its level at the end of February, a trend largely similar to past geopolitical oil shocks. Figure 1: Oil Market Performance Similar to Historical Supply Shocks The June futures contract for West Texas Intermediate (WTI) crude oil is often abbreviated as CL6. However, the performance of other major asset classes has not replicated the classic trajectory of historical supply shocks. Figure 2 shows that investment-grade credit spreads are essentially flat compared to February. Figure 3 shows that US Treasury yields will rise significantly in 2026, with a trend more similar to the period of the Russia-Ukraine conflict in 2022 than the first Gulf War in 1991. Rising energy prices have led many investors to expect further interest rate hikes by central banks, which is the core driver of rising real yields. For credit market investors, although credit spreads remain narrow, rising Treasury yields have pushed up total bond yields, which has supported market demand to some extent. Figure 2: US investment-grade credit spreads are essentially flat compared to before the Iran conflict. Investment-grade bonds are represented by the Bloomberg U.S. Corporate Dollar Total Return Index. Figure 3: Since the outbreak of the Iran conflict, U.S. Treasury yields have continued to rise. While the interest rate fluctuations at the beginning of the 2022 Russia-Ukraine conflict might seem like a useful framework for understanding the current conflict, traditional macroeconomic logic offers a different conclusion. Historically, energy supply shocks often evolve from inflation panics to growth panics: investors eventually chase safe-haven assets, driving yields down (see Figure 3 again). 2022 was an exception due to its unique economic starting point. During the 2020 pandemic, policy rates in most countries were lowered to near zero; central banks launched large-scale asset purchases, pushing long-term yields to multi-decade lows; simultaneously, massive fiscal stimulus boosted aggregate demand, but encountered supply chain bottlenecks, ultimately causing inflation to soar. At the outset of the current Iranian conflict, none of these conditions existed. Why is this shock different? We believe two core factors have supported the resilience of the US economy so far this year in the face of energy shocks. The first is the intensity of the economy's oil consumption. Figure 4 shows that since the 1980s, the number of barrels of crude oil consumed per unit of output generated by US real GDP has shown a sustained structural decline. Figure 4: Since the 1980s, the oil consumption intensity of the US economy has shown a structural downward trend. The annual data is updated to 2024, and the data acquisition date is September 30, 2026. Oil consumption intensity measures the amount of oil consumed to generate GDP. For reference, during the first Gulf War in 1991, the US consumed approximately twice the amount of oil needed to generate the same level of GDP as it does today. To put it another way: over the past 50 years, the US has transformed from a manufacturing-led economy to a service-led economy, and the service sector is naturally less sensitive to oil as a production factor. This does not mean that the US is completely unaffected by soaring energy prices. Rather, it means that to replicate the economic slowdown of periods like the first Gulf War, a more intense and longer-lasting energy shock would be needed. The second factor comes from the artificial intelligence investment cycle. In recent months, market expectations for capital expenditures related to the AI ecosystem have continued to rise. Bloomberg's consensus analyst forecast shows that capital expenditures by AI megacities alone may exceed $1 trillion by 2027. Such a scale of capital expenditure has stabilized market expectations for economic growth, boosted risk appetite, and to some extent curbed the transmission of high energy prices to a wider range of risky assets. Supply-side pressures are showing initial signs of easing. Meanwhile, we are observing some positive signals: Persian Gulf crude oil circulation is gradually converging towards the 2025 average. Commodity analyst assessments, news reports, and satellite tracking data indicate that crude oil exports may have recovered to 80%-90% of pre-Iranian conflict levels in recent weeks. Considering the shipping disruptions in the Strait of Hormuz and the Bab el-Mandeb Strait, this recovery level is considerable. Even so, crude oil inventories remain under pressure, and a full return to normal supply still faces significant risks. Furthermore, the increase in the number of drilling rigs suggests that US crude oil production may gradually rise, but at a moderate pace. Baker Hughes statistics show that the number of active drilling rigs in the US will increase by 10% so far in 2026, currently around 600, close to the level at the beginning of 2025 (see Figure 5). However, looking back at the history of the boom-and-bust US energy industry, this round of expansion by oil and gas exploration and production companies is more cautious; compared to before the 2020 pandemic, companies are no longer as responsive to oil price fluctuations. Figure 5: The number of active oil drilling rigs in the United States will increase slightly in 2026 (year-to-date). Risks Requiring Close Monitoring While the US economy is currently showing resilience and Gulf oil shipping is showing positive signs, and our baseline scenario suggests that energy prices may gradually decline according to the pricing logic of the futures market, the subsequent path remains fraught with risks. Bottlenecks in the refining sector and the refined oil market are real; the transmission of energy shocks to the real economy depends not only on crude oil prices, but also on diesel, jet fuel, and gasoline prices. Even if crude oil circulation is close to recovery, high energy costs still pose a risk of suppressing consumer spending and overall economic activity. More importantly, the geopolitical situation remains highly volatile. If the crude oil or refined oil markets suffer another supply disruption, the combination of growth and inflation will worsen, and policymakers will face the dilemma of simultaneously weakening the economy and rising inflation. In short, if disruptions to the oil and refined oil supply chain continue, growth expectations and risk assets will become increasingly vulnerable to shocks; however, this round of adjustment may take longer than in previous cycles. The current divergence between various asset classes, contrary to historical patterns, will not last forever.
- Risk Warning and Disclaimer
- The market involves risk, and trading may not be suitable for all investors. This article is for reference only and does not constitute personal investment advice, nor does it take into account certain users’ specific investment objectives, financial situation, or other needs. Any investment decisions made based on this information are at your own risk.