Why has gold underperformed expectations?
2026-10-07 23:36:19
Ten days ago, I believed that two major positive catalysts were building momentum, potentially triggering another round of currency devaluation trading. Since then, even with numerous policy signals from the Federal Reserve and a slight decline in oil prices—meaning the two catalysts I previously identified were progressing favorably—gold prices have fallen. This article will quickly review the current market situation.  My core view is that the market's pricing in the Fed's policy is still overly hawkish, and this expectation has significant room for correction. Meanwhile, the market is filled with concerns about the situation in Iran: under the heavy pressure of US sanctions, the Iranian economy is strained, and the market fears that Iran will further escalate the conflict. A new round of gold price increases driven by currency devaluation is still in its infancy, but this rally is inevitable.
 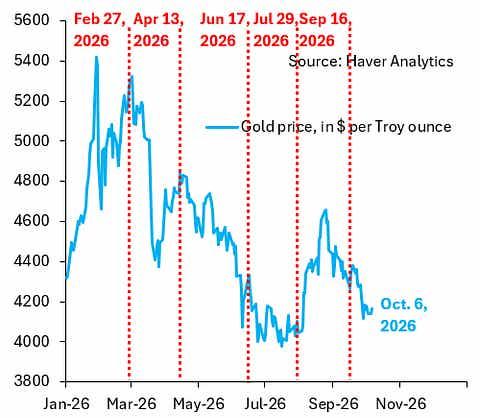 The blue line in the chart represents the price of gold. The red vertical line represents the key turning points in the market this year: (1) the outbreak of the conflict with Iran on the night of February 27; (2) the US imposed a blockade on Iran on April 13; (3) the signing of a memorandum of understanding with Iran on June 17; (4) the Fed's interest rate meeting on July 29, which released a dovish tone, pushing up the yield on long-term US Treasury bonds and the price of precious metals; (5) the Fed raised interest rates on September 16. The gold price increase brought about by the interest rate meeting on July 29 has now been almost completely wiped out. Gold prices rose by more than 12% in August, but now the increase is only slightly higher than 3%. Since the Fed has turned dovish and oil prices have also fallen, why has gold failed to perform better?
 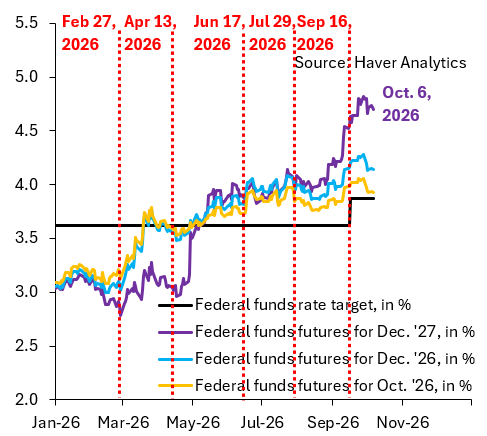 The chart above shows market pricing expectations for Federal Reserve policy. The orange curve indicates that recent speeches by Fed officials have led the market to lower its expectations for rate hikes on October 28th and for the remainder of the year (blue curve); however, the market has made almost no adjustment to its pricing expectations for rate hikes before the end of next year (purple curve). This means that the market is still clinging to the narrative that the Fed will maintain a tough tightening stance. Only when the market abandons its bets on future rate hikes will gold experience a significant surge, and the market will eventually correct its expectations.
 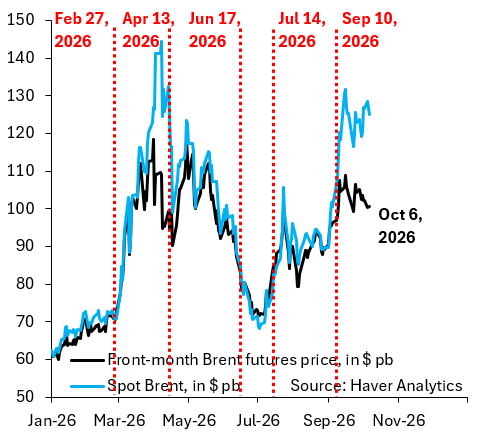 The oil price situation is equally unpredictable. As shown by the black curve in the chart, near-month crude oil futures prices have declined slightly. This aligns with a phenomenon I mentioned a month ago: a large amount of crude oil is being transported out of the country via the Strait of Hormuz, and Saudi Arabia's East-West oil pipeline has been quickly repaired and resumed operation. However, Brent crude oil spot prices (blue curve) remain high. I believe this stems from a risk premium: the impact of the US blockade on the Iranian economy continues to intensify, and the market, out of rational consideration, is concerned about an escalation of the conflict. In summary, gold's current performance is not unusual. The two catalysts I mentioned ten days ago are developing in a positive direction, albeit at a slower pace. A new round of large-scale gold price increases is still in its early stages, but this rise is inevitable.
My core view is that the market's pricing in the Fed's policy is still overly hawkish, and this expectation has significant room for correction. Meanwhile, the market is filled with concerns about the situation in Iran: under the heavy pressure of US sanctions, the Iranian economy is strained, and the market fears that Iran will further escalate the conflict. A new round of gold price increases driven by currency devaluation is still in its infancy, but this rally is inevitable. The blue line in the chart represents the price of gold. The red vertical line represents the key turning points in the market this year: (1) the outbreak of the conflict with Iran on the night of February 27; (2) the US imposed a blockade on Iran on April 13; (3) the signing of a memorandum of understanding with Iran on June 17; (4) the Fed's interest rate meeting on July 29, which released a dovish tone, pushing up the yield on long-term US Treasury bonds and the price of precious metals; (5) the Fed raised interest rates on September 16. The gold price increase brought about by the interest rate meeting on July 29 has now been almost completely wiped out. Gold prices rose by more than 12% in August, but now the increase is only slightly higher than 3%. Since the Fed has turned dovish and oil prices have also fallen, why has gold failed to perform better? The chart above shows market pricing expectations for Federal Reserve policy. The orange curve indicates that recent speeches by Fed officials have led the market to lower its expectations for rate hikes on October 28th and for the remainder of the year (blue curve); however, the market has made almost no adjustment to its pricing expectations for rate hikes before the end of next year (purple curve). This means that the market is still clinging to the narrative that the Fed will maintain a tough tightening stance. Only when the market abandons its bets on future rate hikes will gold experience a significant surge, and the market will eventually correct its expectations. The oil price situation is equally unpredictable. As shown by the black curve in the chart, near-month crude oil futures prices have declined slightly. This aligns with a phenomenon I mentioned a month ago: a large amount of crude oil is being transported out of the country via the Strait of Hormuz, and Saudi Arabia's East-West oil pipeline has been quickly repaired and resumed operation. However, Brent crude oil spot prices (blue curve) remain high. I believe this stems from a risk premium: the impact of the US blockade on the Iranian economy continues to intensify, and the market, out of rational consideration, is concerned about an escalation of the conflict. In summary, gold's current performance is not unusual. The two catalysts I mentioned ten days ago are developing in a positive direction, albeit at a slower pace. A new round of large-scale gold price increases is still in its early stages, but this rise is inevitable.
- Risk Warning and Disclaimer
- The market involves risk, and trading may not be suitable for all investors. This article is for reference only and does not constitute personal investment advice, nor does it take into account certain users’ specific investment objectives, financial situation, or other needs. Any investment decisions made based on this information are at your own risk.