Gold prices test $4,100: Dollar and Treasury yields rise ahead of FOMC meeting minutes.
2026-10-08 00:24:18
On Wednesday (October 7), spot gold continued its decline, falling nearly 1.27%. Gold prices had rebounded slightly the previous day, followed by a renewed rise in the US dollar and US Treasury yields. Spot gold traded around $4110 during the session. The market is awaiting the release of the minutes from the Federal Reserve's September monetary policy meeting, scheduled for 18:00 GMT.  The US dollar index (DXY) is currently trading around 102.28, near its highest level since April 2025. Meanwhile, the benchmark US 10-year Treasury yield climbed to 5.315%, a new high since 2002, before falling back to 5.315%. The risks of rising oil prices and inflation due to the Middle East conflict, concerns about increasing government debt and fiscal deficits, coupled with the resilience of the US economy, have collectively pushed up borrowing costs. Rising Treasury yields increase the opportunity cost of holding non-interest-bearing assets like gold, while boosting demand for the dollar, making it more expensive for buyers using other currencies to purchase gold. Despite a decline in gold prices on Wednesday, gold has remained within a trading range for most of the past week. Recent weaker-than-expected US employment and personal consumption expenditure (PCE) inflation data have led traders to reassess the Federal Reserve's monetary policy path. The market widely expects the Fed to keep interest rates unchanged at its October 27-28 meeting, following a 25 basis point rate hike in September. However, high energy prices pose a persistent risk of inflation, and the possibility of another interest rate hike in December remains. Against this backdrop, traders will carefully study the Federal Open Market Committee (FOMC) meeting minutes for further guidance on the possibility of further monetary policy tightening. Since the outbreak of the Middle East conflict at the end of February, hawkish policy expectations have continued to weigh on gold prices, which are currently down more than 25% from their January high of nearly $5,600. Even so, long-term buying demand continues to provide underlying support for gold prices. Central banks around the world continue to purchase gold, with China leading the way in gold demand in August. Analysts at ING Group pointed out that official institutions' demand for gold remains strong. Data from the World Gold Council (WGC) shows that "central banks remained net buyers of gold in August, adding a total of 39 tons, bringing their year-to-date purchases to 170 tons." ING stated that China remains the main buyer, with the People's Bank of China "purchasing 20 tons of gold, extending its continuous gold purchase period to 22 months." Other emerging European and Central Asian countries also saw significant increases in their holdings, with Poland and Uzbekistan each adding 8 tons to their gold reserves. This continued gold purchase reflects the ongoing important role gold plays in the diversification of central bank foreign exchange reserves. Technical Analysis: Spot gold is trading below key moving averages, with a slightly bearish bias in the current consolidation pattern.
 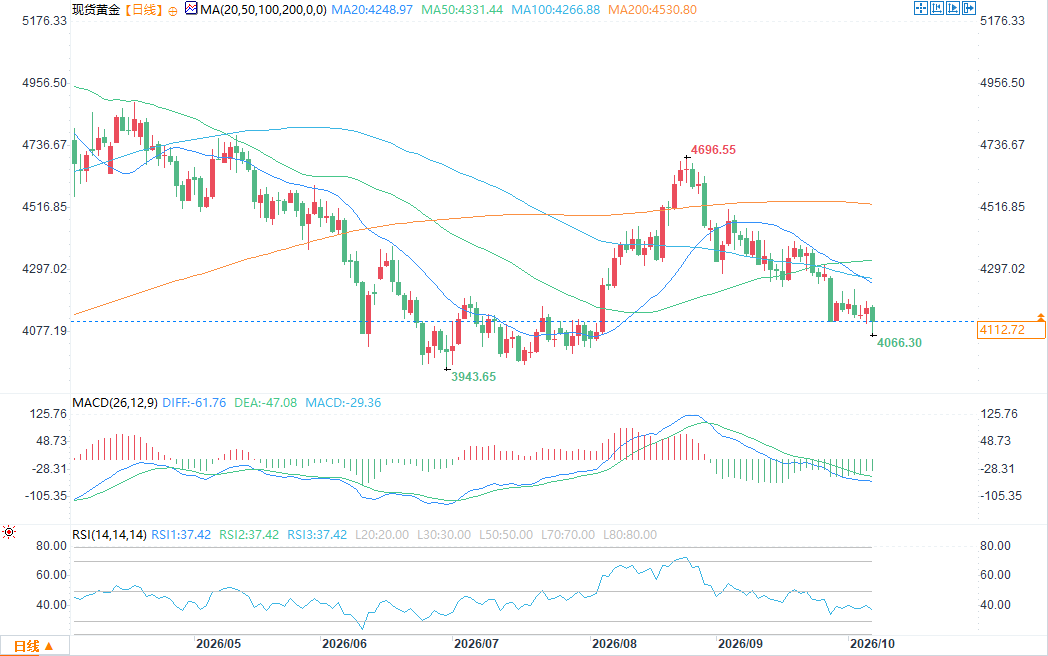 (Spot Gold Daily Chart Source: FX678) On the daily chart, spot gold is approaching the lower edge of the $4100-$4200 trading range. The price is well below the 100-day and 200-day simple moving averages, located at $4267 and $4530 respectively, indicating an overall bearish technical outlook. Momentum indicators show bearish signals, but suggest that selling pressure has weakened. The Relative Strength Index (RSI) is close to 38, not yet in oversold territory; the Moving Average Convergence Divergence (MACD) remains negative, with the red bars in the histogram narrowing. On the downside, the $4100 level is the first short-term support. A break below this level could see the price test the year's lows, in the $3950-$4000 range. On the upside, initial resistance is at $4200, with the next resistance at the 100-day moving average of $4267. If gold prices rebound strongly, the next target will be the $4,400 resistance level; while the 200-day moving average around $4,530 remains a major obstacle for the bulls to overcome.
The US dollar index (DXY) is currently trading around 102.28, near its highest level since April 2025. Meanwhile, the benchmark US 10-year Treasury yield climbed to 5.315%, a new high since 2002, before falling back to 5.315%. The risks of rising oil prices and inflation due to the Middle East conflict, concerns about increasing government debt and fiscal deficits, coupled with the resilience of the US economy, have collectively pushed up borrowing costs. Rising Treasury yields increase the opportunity cost of holding non-interest-bearing assets like gold, while boosting demand for the dollar, making it more expensive for buyers using other currencies to purchase gold. Despite a decline in gold prices on Wednesday, gold has remained within a trading range for most of the past week. Recent weaker-than-expected US employment and personal consumption expenditure (PCE) inflation data have led traders to reassess the Federal Reserve's monetary policy path. The market widely expects the Fed to keep interest rates unchanged at its October 27-28 meeting, following a 25 basis point rate hike in September. However, high energy prices pose a persistent risk of inflation, and the possibility of another interest rate hike in December remains. Against this backdrop, traders will carefully study the Federal Open Market Committee (FOMC) meeting minutes for further guidance on the possibility of further monetary policy tightening. Since the outbreak of the Middle East conflict at the end of February, hawkish policy expectations have continued to weigh on gold prices, which are currently down more than 25% from their January high of nearly $5,600. Even so, long-term buying demand continues to provide underlying support for gold prices. Central banks around the world continue to purchase gold, with China leading the way in gold demand in August. Analysts at ING Group pointed out that official institutions' demand for gold remains strong. Data from the World Gold Council (WGC) shows that "central banks remained net buyers of gold in August, adding a total of 39 tons, bringing their year-to-date purchases to 170 tons." ING stated that China remains the main buyer, with the People's Bank of China "purchasing 20 tons of gold, extending its continuous gold purchase period to 22 months." Other emerging European and Central Asian countries also saw significant increases in their holdings, with Poland and Uzbekistan each adding 8 tons to their gold reserves. This continued gold purchase reflects the ongoing important role gold plays in the diversification of central bank foreign exchange reserves. Technical Analysis: Spot gold is trading below key moving averages, with a slightly bearish bias in the current consolidation pattern. (Spot Gold Daily Chart Source: FX678) On the daily chart, spot gold is approaching the lower edge of the $4100-$4200 trading range. The price is well below the 100-day and 200-day simple moving averages, located at $4267 and $4530 respectively, indicating an overall bearish technical outlook. Momentum indicators show bearish signals, but suggest that selling pressure has weakened. The Relative Strength Index (RSI) is close to 38, not yet in oversold territory; the Moving Average Convergence Divergence (MACD) remains negative, with the red bars in the histogram narrowing. On the downside, the $4100 level is the first short-term support. A break below this level could see the price test the year's lows, in the $3950-$4000 range. On the upside, initial resistance is at $4200, with the next resistance at the 100-day moving average of $4267. If gold prices rebound strongly, the next target will be the $4,400 resistance level; while the 200-day moving average around $4,530 remains a major obstacle for the bulls to overcome.
- Risk Warning and Disclaimer
- The market involves risk, and trading may not be suitable for all investors. This article is for reference only and does not constitute personal investment advice, nor does it take into account certain users’ specific investment objectives, financial situation, or other needs. Any investment decisions made based on this information are at your own risk.