Gold has rebounded from its lows, but is a bright future on the horizon?
2026-10-09 02:12:16
Gold prices have been struggling for six weeks after encountering resistance at $4,700 and subsequently falling back. The Federal Reserve paused interest rate hikes in July, followed by the US Treasury's announcement of bond buybacks; these two positive factors initially boosted gold prices. However, since then, the market environment has deteriorated sharply: US Treasury yields have soared, and market expectations for the FOMC have become increasingly hawkish.  However, from a macroeconomic perspective, the situation has not completely deteriorated. The gold price correction earlier this year was merely a cooling-off period for the severely overbought market of the previous two years. $4,000 was a key level last year: in October, this level provided support for five consecutive weeks. Subsequently, the Federal Reserve began its rate-cutting cycle, and gold surged again, breaking through $5,000 and reaching a high of nearly $5,600 per ounce. At that time, the market was almost in a frenzy, and considering the macroeconomic environment, the fundamental logic behind this round of gains was sound. The Federal Reserve's second round of rate cuts, even with inflation still above the 2% target, further reduced the attractiveness of the dollar as a reserve asset. Rate cuts coupled with persistently high inflation mean that the purchasing power of fiat currencies is diluted; however, fiat currencies can only be compared against each other, and this weakening of purchasing power is not directly reflected in the exchange rates of the euro, yen, and pound. But the total supply of gold is limited, and as fiat currencies continue to be diluted, the value difference between them will be clearly reflected in the gold price. For example, $2,000 was a strong resistance level that gold struggled to break through for three and a half years. Gold prices didn't break through the resistance level until the Federal Reserve shifted to a dovish stance in early 2024, and continued to rise for the next two years. However, the market rhythm changed this year, with a difficult-to-control variable being the rise in oil prices. Oil is not only used for transportation; it has a wide-ranging impact on the entire economy, which explains the rebound in gold prices in March. Subsequently, as inflation rose again, gold prices continued to fall. Even so, the $4,000 level remained unbreakable in the early stages, with buyers consistently entering the market to support prices whenever they approached that level. However, Kevin Warsh's first appearance at the Federal Reserve, with his statements far exceeding market expectations of a hawkish stance (the market had initially believed that this successor to the FOMC chairman, personally selected by Trump, would lean towards easing), finally triggered a retest of the $4,000 level for gold. This round of decline lasted for seven weeks, continuing until after the July FOMC meeting. But it is clear that whenever spot gold falls below this significant psychological level, funds enter the market to buy based on value logic. Bearish forces remain dominant. Bears had the opportunity to continue pushing prices down after the breakout, but chose to retreat, failing to sustain the sell-off. This is often an early signal of a reversal. This market pattern indicates that it is deeply oversold, and available short-selling power has been exhausted. After prices hit new lows, short sellers took profits, leading to a rebound in gold prices. Yesterday's scenario was a good example: a descending triangle pattern was completed, and bears had every opportunity to further drive prices down after the breakout, but they missed the opportunity, and gold prices rebounded back to the familiar 4135 level. It's important to note that the disappearance of negative factors does not directly equate to a positive signal, but it is a new, preliminary signal.
 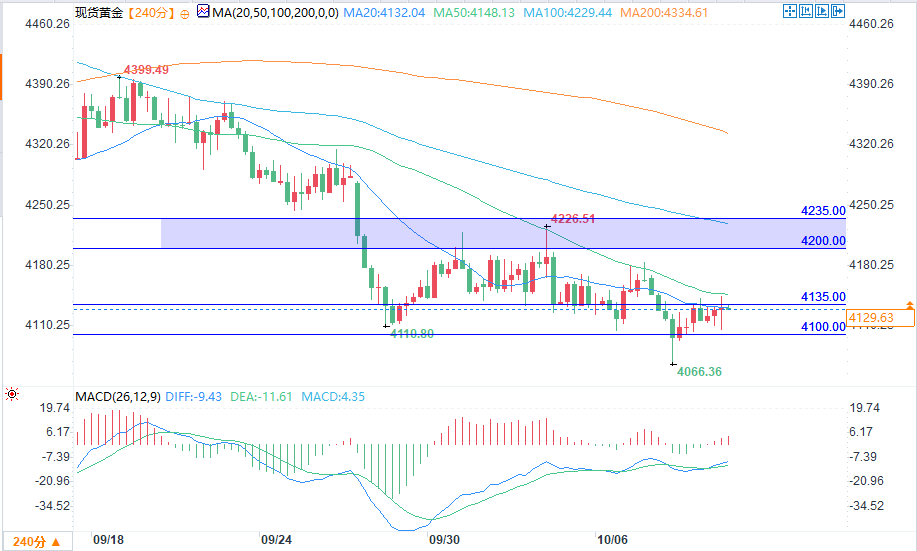 (Spot gold 4-hour chart source: EasyTrade) For a reversal to be confirmed, the bulls need to exert force, pushing prices to higher highs to demonstrate the buying intent. This hasn't happened yet; the 4135 level is currently acting as resistance. However, if 4100 holds, forming a higher low support, or if a higher low forms above yesterday's low of 4066, it will pave the way for a subsequent bullish move. The clear resistance zone above is 4200-4235; only a decisive break above this range will make the bullish trend more convincing. However, there is still considerable room for movement before reaching this level. At this stage, if gold prices retrace and hold above 4135, forming a higher low, it would be an early sign of a trend reversal. From a weekly perspective: if this week's weekly chart closes positive, even if it's just a doji, it will further strengthen the credibility of the assessment that "bearish momentum has exhausted."
However, from a macroeconomic perspective, the situation has not completely deteriorated. The gold price correction earlier this year was merely a cooling-off period for the severely overbought market of the previous two years. $4,000 was a key level last year: in October, this level provided support for five consecutive weeks. Subsequently, the Federal Reserve began its rate-cutting cycle, and gold surged again, breaking through $5,000 and reaching a high of nearly $5,600 per ounce. At that time, the market was almost in a frenzy, and considering the macroeconomic environment, the fundamental logic behind this round of gains was sound. The Federal Reserve's second round of rate cuts, even with inflation still above the 2% target, further reduced the attractiveness of the dollar as a reserve asset. Rate cuts coupled with persistently high inflation mean that the purchasing power of fiat currencies is diluted; however, fiat currencies can only be compared against each other, and this weakening of purchasing power is not directly reflected in the exchange rates of the euro, yen, and pound. But the total supply of gold is limited, and as fiat currencies continue to be diluted, the value difference between them will be clearly reflected in the gold price. For example, $2,000 was a strong resistance level that gold struggled to break through for three and a half years. Gold prices didn't break through the resistance level until the Federal Reserve shifted to a dovish stance in early 2024, and continued to rise for the next two years. However, the market rhythm changed this year, with a difficult-to-control variable being the rise in oil prices. Oil is not only used for transportation; it has a wide-ranging impact on the entire economy, which explains the rebound in gold prices in March. Subsequently, as inflation rose again, gold prices continued to fall. Even so, the $4,000 level remained unbreakable in the early stages, with buyers consistently entering the market to support prices whenever they approached that level. However, Kevin Warsh's first appearance at the Federal Reserve, with his statements far exceeding market expectations of a hawkish stance (the market had initially believed that this successor to the FOMC chairman, personally selected by Trump, would lean towards easing), finally triggered a retest of the $4,000 level for gold. This round of decline lasted for seven weeks, continuing until after the July FOMC meeting. But it is clear that whenever spot gold falls below this significant psychological level, funds enter the market to buy based on value logic. Bearish forces remain dominant. Bears had the opportunity to continue pushing prices down after the breakout, but chose to retreat, failing to sustain the sell-off. This is often an early signal of a reversal. This market pattern indicates that it is deeply oversold, and available short-selling power has been exhausted. After prices hit new lows, short sellers took profits, leading to a rebound in gold prices. Yesterday's scenario was a good example: a descending triangle pattern was completed, and bears had every opportunity to further drive prices down after the breakout, but they missed the opportunity, and gold prices rebounded back to the familiar 4135 level. It's important to note that the disappearance of negative factors does not directly equate to a positive signal, but it is a new, preliminary signal. (Spot gold 4-hour chart source: EasyTrade) For a reversal to be confirmed, the bulls need to exert force, pushing prices to higher highs to demonstrate the buying intent. This hasn't happened yet; the 4135 level is currently acting as resistance. However, if 4100 holds, forming a higher low support, or if a higher low forms above yesterday's low of 4066, it will pave the way for a subsequent bullish move. The clear resistance zone above is 4200-4235; only a decisive break above this range will make the bullish trend more convincing. However, there is still considerable room for movement before reaching this level. At this stage, if gold prices retrace and hold above 4135, forming a higher low, it would be an early sign of a trend reversal. From a weekly perspective: if this week's weekly chart closes positive, even if it's just a doji, it will further strengthen the credibility of the assessment that "bearish momentum has exhausted."
- Risk Warning and Disclaimer
- The market involves risk, and trading may not be suitable for all investors. This article is for reference only and does not constitute personal investment advice, nor does it take into account certain users’ specific investment objectives, financial situation, or other needs. Any investment decisions made based on this information are at your own risk.