US Treasury yields cooled, and the dollar index fell slightly.
2026-10-09 14:40:18
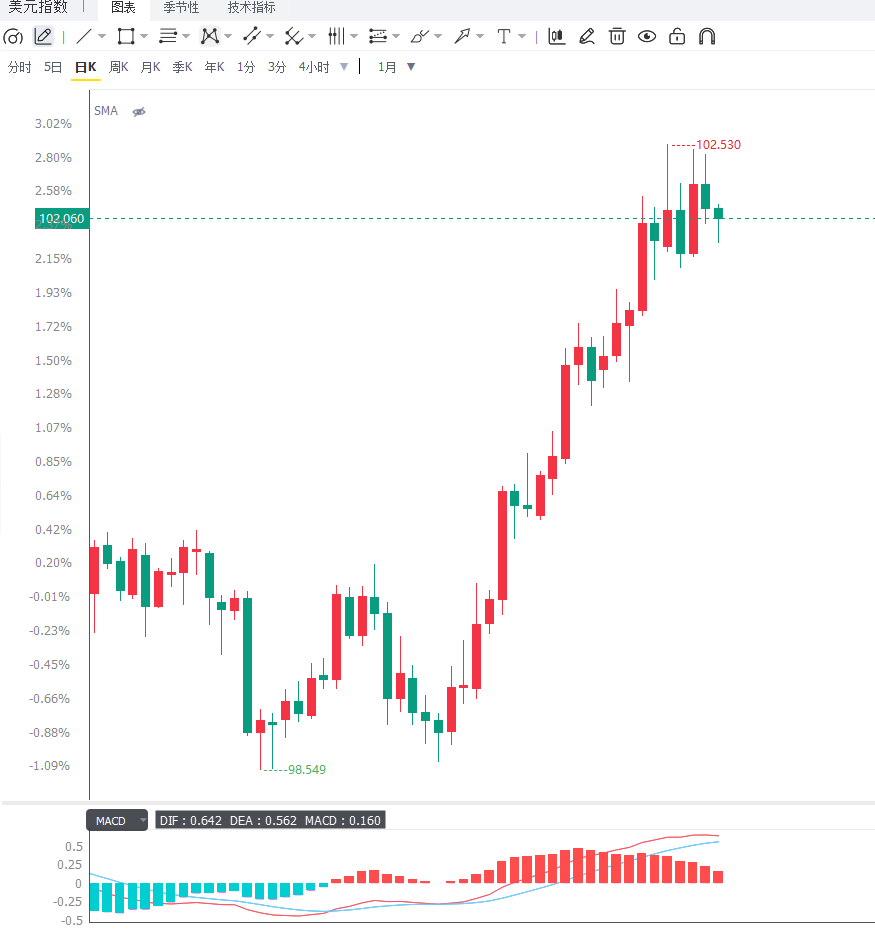
The dollar extended its decline against major currencies on Friday, with the dollar index (DXY) falling to around 102.02 in Asian trading, a drop of approximately 0.1%. This followed the dollar's failure to break through its year-to-date high of 102.54, with significant selling pressure emerging late Thursday, indicating increasing profit-taking pressure at higher levels. Meanwhile, the yield on the 10-year U.S. Treasury note fell from 5.35% on Thursday to around 5.23%, weakening short-term interest rate support for the dollar.  Looking at the performance of major currencies, the US dollar fell by approximately 0.24% against the Australian dollar and New Zealand dollar, about 0.21% against the Swiss franc, and approximately 0.12%, 0.08%, and 0.08% against the euro, pound sterling, and Canadian dollar, respectively; the US dollar bucked the trend, rising by approximately 0.08% against the Japanese yen. This indicates that the decline in the US dollar did not occur synchronously across all currency pairs, and the market is still pricing in differentiated terms based on the policy prospects, growth expectations, and risk appetite of various economies. The decline in US Treasury yields is closely related to changes in risk sentiment in the energy market. US President Donald Trump stated that the US would not launch an attack on Iran before the November 3 midterm elections and that the two sides were having productive discussions. This statement eased market concerns about a short-term escalation of military conflict, pushing oil prices down from previous highs. The slowdown in energy price increases helped temporarily alleviate market concerns about further inflation and also led some investors to reassess the necessity for the Federal Reserve to continue raising interest rates. However, the signals of dialogue between the US and Iran do not mean that geopolitical risks have disappeared. If shipping in the Strait of Hormuz is disrupted again, or energy facilities face new supply risks, oil prices could rebound quickly, pushing up inflation expectations again. For the US dollar, this impact is two-sided: rising energy prices could increase US inflation and interest rate expectations, supporting the dollar; however, if high energy costs exacerbate economic pressures, triggering market risk aversion or growth concerns, the dollar's trajectory could also be influenced by other factors. Monetary policy remains the core variable determining the dollar's medium-term direction. The market currently still expects the Federal Reserve to raise interest rates at least once more for the remainder of the year, reflecting that investors have not completely ruled out the possibility of further tightening. Federal Reserve officials have previously emphasized that if inflation continues to exceed the target level, further rate hikes may still be necessary, but the pace of policy action will depend on economic data. This means that the short-term pullback in the dollar reflects more yield adjustments and profit-taking at higher levels, and is insufficient to prove that the dollar's medium-term strength has ended. Next, market focus will shift to the US September Consumer Price Index (CPI). Inflation data will directly affect the market's judgment on the Fed's policy path this year. If overall and core CPI are higher than expected, investors may raise their pricing for interest rate hikes again, pushing up US Treasury yields and providing new upward momentum for the dollar. If inflation falls short of expectations, the market may reduce its bets on further interest rate hikes, and the dollar and yields may continue to be under pressure. It's important to note that while energy price changes can significantly impact overall CPI, core inflation and service price trends are equally important; a single indicator may not be sufficient to determine the Fed's final decision. From a market structure perspective, the dollar index's previous sustained rise to 102.54 indicates that dollar bulls still hold a certain advantage, but the failure to break through previous highs also suggests significant selling pressure above. Currently, the dollar is in a correction phase within a strong trend. Whether it can regain strength depends on whether yields stabilize, whether inflation data reinforces expectations of interest rate hikes, and whether the dollar can break through its year-to-date high again. On the daily chart, the dollar index is around 102.03, still trading above the 20-day exponential moving average of 101.24, and the overall bullish structure remains intact. The Relative Strength Index (RSI) is 67.91, approaching overbought territory, indicating strong upward momentum, but there is also a risk of profit-taking and technical adjustments in the short term. The first support level to watch is the 20-day moving average around 101.24; a break below this level could lead to further consolidation for the US dollar index. The main resistance level is the year's high around 102.54; a break above this level could open up further upside potential, while continued resistance could lead to increased volatility at higher levels. On the 4-hour chart, the US dollar index failed to continue its upward trend and retreated from around 102.54, indicating a cooling of short-term momentum. If the price holds above 101.80 and retests 102.20, the dollar may retest the 102.54 resistance level; a break below 101.80, coupled with continued declines in US Treasury yields, would require monitoring the support areas around 101.50 and 101.24. These 4-hour levels are for short-term observation and do not represent confirmed technical turning points. Due to the lack of complete 4-hour moving average, MACD, and RSI data, it is currently impossible to confirm whether the short-term correction will evolve into a trend reversal. Trading should focus on price performance before and after the release of the US CPI data, and whether the index can hold above key levels after a breakout.
  Editor's Summary: The US dollar index is currently in a phase of oscillation between high-level pullback and support from expectations of interest rate hikes. The decline in US Treasury yields from recent highs, coupled with signals of dialogue between the US and Iran, has weakened the dollar's short-term upward momentum; however, the market still expects the Federal Reserve to continue raising interest rates this year, and the dollar's medium-term support has not completely disappeared. The core variables for future market movements will be the US September CPI, the trend of Treasury yields, and expectations of Federal Reserve policy. If inflation is higher than expected, the dollar may retest its yearly high of 102.54; if inflation cools and yields continue to decline, the dollar may pull back further, testing the daily moving average support around 101.24. It is advisable to avoid judging a trend reversal of the dollar solely based on short-term declines. Focus should be placed on observing yield changes and key technical levels after the release of inflation data, while also being wary of market volatility caused by changes in geopolitical situations.
Looking at the performance of major currencies, the US dollar fell by approximately 0.24% against the Australian dollar and New Zealand dollar, about 0.21% against the Swiss franc, and approximately 0.12%, 0.08%, and 0.08% against the euro, pound sterling, and Canadian dollar, respectively; the US dollar bucked the trend, rising by approximately 0.08% against the Japanese yen. This indicates that the decline in the US dollar did not occur synchronously across all currency pairs, and the market is still pricing in differentiated terms based on the policy prospects, growth expectations, and risk appetite of various economies. The decline in US Treasury yields is closely related to changes in risk sentiment in the energy market. US President Donald Trump stated that the US would not launch an attack on Iran before the November 3 midterm elections and that the two sides were having productive discussions. This statement eased market concerns about a short-term escalation of military conflict, pushing oil prices down from previous highs. The slowdown in energy price increases helped temporarily alleviate market concerns about further inflation and also led some investors to reassess the necessity for the Federal Reserve to continue raising interest rates. However, the signals of dialogue between the US and Iran do not mean that geopolitical risks have disappeared. If shipping in the Strait of Hormuz is disrupted again, or energy facilities face new supply risks, oil prices could rebound quickly, pushing up inflation expectations again. For the US dollar, this impact is two-sided: rising energy prices could increase US inflation and interest rate expectations, supporting the dollar; however, if high energy costs exacerbate economic pressures, triggering market risk aversion or growth concerns, the dollar's trajectory could also be influenced by other factors. Monetary policy remains the core variable determining the dollar's medium-term direction. The market currently still expects the Federal Reserve to raise interest rates at least once more for the remainder of the year, reflecting that investors have not completely ruled out the possibility of further tightening. Federal Reserve officials have previously emphasized that if inflation continues to exceed the target level, further rate hikes may still be necessary, but the pace of policy action will depend on economic data. This means that the short-term pullback in the dollar reflects more yield adjustments and profit-taking at higher levels, and is insufficient to prove that the dollar's medium-term strength has ended. Next, market focus will shift to the US September Consumer Price Index (CPI). Inflation data will directly affect the market's judgment on the Fed's policy path this year. If overall and core CPI are higher than expected, investors may raise their pricing for interest rate hikes again, pushing up US Treasury yields and providing new upward momentum for the dollar. If inflation falls short of expectations, the market may reduce its bets on further interest rate hikes, and the dollar and yields may continue to be under pressure. It's important to note that while energy price changes can significantly impact overall CPI, core inflation and service price trends are equally important; a single indicator may not be sufficient to determine the Fed's final decision. From a market structure perspective, the dollar index's previous sustained rise to 102.54 indicates that dollar bulls still hold a certain advantage, but the failure to break through previous highs also suggests significant selling pressure above. Currently, the dollar is in a correction phase within a strong trend. Whether it can regain strength depends on whether yields stabilize, whether inflation data reinforces expectations of interest rate hikes, and whether the dollar can break through its year-to-date high again. On the daily chart, the dollar index is around 102.03, still trading above the 20-day exponential moving average of 101.24, and the overall bullish structure remains intact. The Relative Strength Index (RSI) is 67.91, approaching overbought territory, indicating strong upward momentum, but there is also a risk of profit-taking and technical adjustments in the short term. The first support level to watch is the 20-day moving average around 101.24; a break below this level could lead to further consolidation for the US dollar index. The main resistance level is the year's high around 102.54; a break above this level could open up further upside potential, while continued resistance could lead to increased volatility at higher levels. On the 4-hour chart, the US dollar index failed to continue its upward trend and retreated from around 102.54, indicating a cooling of short-term momentum. If the price holds above 101.80 and retests 102.20, the dollar may retest the 102.54 resistance level; a break below 101.80, coupled with continued declines in US Treasury yields, would require monitoring the support areas around 101.50 and 101.24. These 4-hour levels are for short-term observation and do not represent confirmed technical turning points. Due to the lack of complete 4-hour moving average, MACD, and RSI data, it is currently impossible to confirm whether the short-term correction will evolve into a trend reversal. Trading should focus on price performance before and after the release of the US CPI data, and whether the index can hold above key levels after a breakout. Editor's Summary: The US dollar index is currently in a phase of oscillation between high-level pullback and support from expectations of interest rate hikes. The decline in US Treasury yields from recent highs, coupled with signals of dialogue between the US and Iran, has weakened the dollar's short-term upward momentum; however, the market still expects the Federal Reserve to continue raising interest rates this year, and the dollar's medium-term support has not completely disappeared. The core variables for future market movements will be the US September CPI, the trend of Treasury yields, and expectations of Federal Reserve policy. If inflation is higher than expected, the dollar may retest its yearly high of 102.54; if inflation cools and yields continue to decline, the dollar may pull back further, testing the daily moving average support around 101.24. It is advisable to avoid judging a trend reversal of the dollar solely based on short-term declines. Focus should be placed on observing yield changes and key technical levels after the release of inflation data, while also being wary of market volatility caused by changes in geopolitical situations.
- Risk Warning and Disclaimer
- The market involves risk, and trading may not be suitable for all investors. This article is for reference only and does not constitute personal investment advice, nor does it take into account certain users’ specific investment objectives, financial situation, or other needs. Any investment decisions made based on this information are at your own risk.