Record inflows into global gold ETFs, coupled with geopolitical uncertainty, supported a rebound in gold prices.
2026-10-12 11:20:25
After rebounding from its lows last week, international gold prices continued their upward trend in Asian trading on Monday. Spot gold traded around $4,205 per ounce, while COMEX gold futures closed at $4,191 on Friday, a cumulative increase of $57.30 this week, or 1.39%, ending two consecutive weeks of decline. Friday's single-day gain was particularly significant, reaching 1.43%, the largest single-day increase since September 3rd, indicating that bullish forces are gradually accumulating in the market at lower levels.  The structural recovery in investment demand is one of the core factors supporting current gold prices. Global physical gold-backed ETFs saw net inflows of approximately $10 billion in September, pushing cumulative net inflows in the third quarter to a record $31 billion, led by funds listed in Europe and North America. Market surveys show that despite the decline in gold prices in September, global gold ETF holdings bucked the trend, increasing by 67 tons to a record high of 4,256 tons. This "buying on dips" phenomenon has attracted significant market attention—despite the triple headwinds of gold price corrections, soaring US Treasury yields, and a strengthening dollar, ETF funds maintained net inflows every trading day, reflecting that long-term investors are viewing price corrections as strategic buying opportunities rather than signals of a trend reversal. The World Gold Council's 2026 Central Bank Gold Reserves Survey shows that 89% of surveyed central banks expect global central bank gold reserves to continue increasing over the next 12 months, and 45% expect their own gold reserves to increase, both record highs for the survey. Over the past four years, global central banks have purchased an average of approximately 1,000 tons of gold annually, significantly higher than the previous decade's average of around 500 tons per year. Goldman Sachs predicts that by the end of 2027, almost all of the approximately 23% increase in gold prices will be driven by central bank demand, with its tracking model showing a current global central bank gold purchase rate of approximately 91 tons per month. However, the Federal Reserve's hawkish stance and the resilience of US economic data constitute the main forces currently suppressing gold price increases. In his latest speech, St. Louis Fed President Mussaliem explicitly stated that "more monetary policy tightening" is needed to bring inflation back to the 2% target level, while emphasizing that the US economy is "quite strong" and the job market is "balanced and stable." Market surveys, using the CME FedWatch Tool, show that traders expect a 17.7% probability of a rate hike in October, but price in an 84.1% probability of at least a 25 basis point rate hike in December. A tracking index of Federal Reserve officials' speeches showed that Musalaem's hawkish rating for this speech was 7.3, roughly in line with his historical average of 7.2. While the Fed sentiment index dipped slightly by 0.25 points to 138.33, it remained firmly above the neutral benchmark of 100, indicating that overall policy communication remained significantly hawkish. This week, the market will face a dense test of several key economic data releases. The US September Consumer Price Index will be released on Wednesday, followed by the Producer Price Index and retail sales data on Thursday. If the inflation reading is stronger than expected, it could trigger a hawkish repricing of the Fed's interest rate path, pushing the dollar and US Treasury yields higher, putting new pressure on dollar-denominated gold. Conversely, weaker data could alleviate concerns about interest rate hikes, providing additional upward momentum for precious metals. It is worth noting that the dollar index rose 0.12% on Friday, closing at 102.23, and has risen approximately 0.3% this week, marking its fourth consecutive week of gains, the longest winning streak since May 2025. The 10-year US Treasury yield remains near a multi-year high of 5.24%, significantly increasing the opportunity cost of holding non-interest-bearing gold. Strategists at TD Securities point out that trend-following funds are adjusting their holdings in precious metals. "Commodity trading advisors are covering their short positions in gold and platinum," with short covering accounting for approximately 7% of their historically largest holdings, reflecting a shift in systemic funds' attitude towards precious metals towards a more supportive direction. TD Securities believes that "geopolitical risks, fiscal concerns, dollar depreciation, de-dollarization, and stagflation concerns remain the main factors supporting these funds flowing into gold," and predicts that "gold is setting the stage for further decoupling from real interest rates and initiating a new bull market extending into 2027." From a technical perspective, gold prices have shown signs of stabilization after a significant correction on the daily chart, but are still trading below the 20-day Bollinger Band middle line, indicating that the overall weak structure has not yet fully reversed. The 14-period Relative Strength Index (RSI) has risen to around 47, below the 50 neutral line, indicating that sellers still have some advantage, but downward momentum is weakening. The lower Bollinger Band at around $4055 forms a strong support zone. If gold prices fall further to this area, bargain hunting is expected. On the upside, the 20-day Bollinger Band middle line at around $4225 forms the first key resistance level, followed by the 100-day simple moving average at around $4255. Only a recapture of these two areas could significantly alleviate the weakness on the daily chart. Further strong resistance lies near the upper Bollinger Band at around $4400. Looking at the 4-hour chart, after rebounding from the low near $4066, the 5-day, 10-day, and 20-day moving averages have all turned upwards. The MACD indicator's DIFF has crossed above the DEA, forming a golden cross, and the red bars are expanding, indicating some short-term bullish momentum. Last week, gold prices briefly broke through the downtrend line, but strong resistance remains in the $4225-$4235 area. An upward trend line has formed on the hourly chart, reflecting the current bullish momentum. If gold prices pull back, they may find support in the $4165-$4170 range. Overall, until the strong resistance above $4230 is effectively broken, the rebound should still be considered a technical correction rather than a trend reversal.
 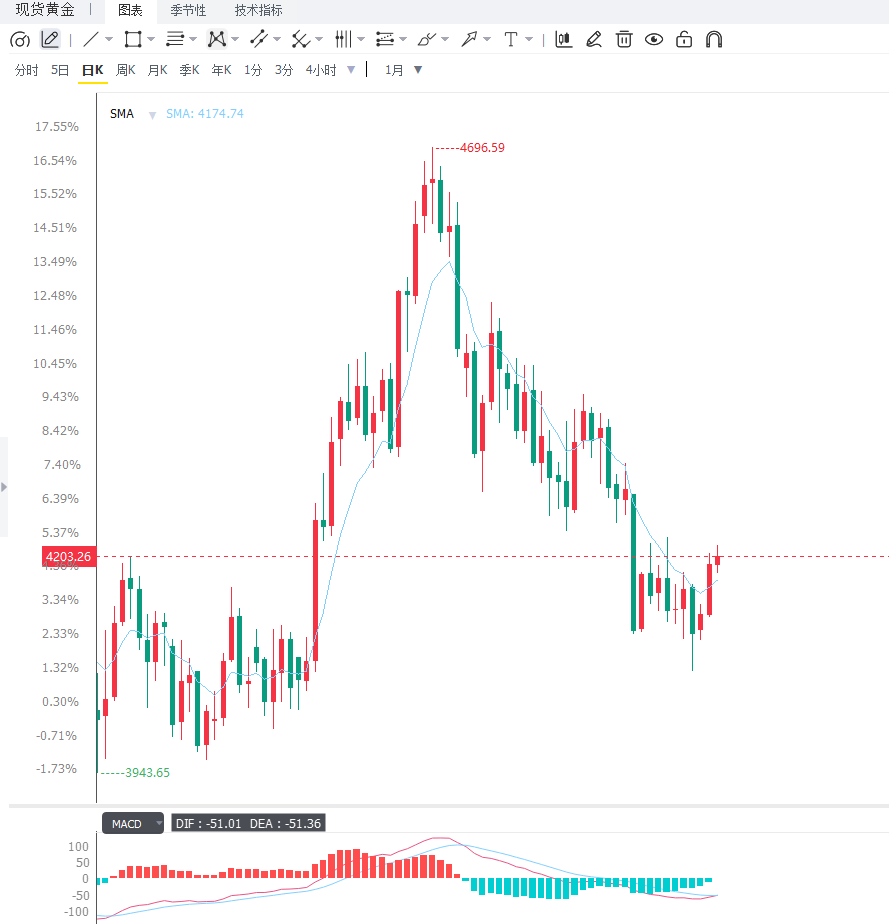 Editor's Summary: The gold market is currently at a critical juncture where bullish and bearish forces are fiercely clashing. Record inflows into global gold ETFs, continued central bank gold purchases, and renewed escalation of geopolitical risks in the Middle East together form a three-tiered protective system for gold prices. Data from the World Gold Council shows that even in an environment of high interest rates and a strong dollar, allocation-oriented funds are still increasing their holdings against the trend, indicating that the market pricing logic has shifted from the traditional "interest rate driven" to a more diversified framework of "credit hedging + reserve diversification." However, the persistence of the Federal Reserve's hawkish stance, the high level of US Treasury yields, and the uncertainty surrounding this week's key CPI data still set a ceiling for a short-term rebound in gold prices. Looking ahead, the direction of gold prices will depend on the evolution of three core variables: whether Wednesday's CPI data can alleviate market concerns about sticky inflation, whether the situation in the Middle East will escalate further into a wider energy supply disruption, and whether subsequent speeches by Federal Reserve officials will signal a slowdown in the pace of interest rate hikes. If CPI data is weak and geopolitical risks escalate, gold prices are expected to break through $4,230 and challenge the $4,300 to $4,400 range; conversely, if inflation data is strong and hawkish expectations from the Federal Reserve solidify further, gold prices may fall back to around $4,100 or even $4,060 to seek support.
The structural recovery in investment demand is one of the core factors supporting current gold prices. Global physical gold-backed ETFs saw net inflows of approximately $10 billion in September, pushing cumulative net inflows in the third quarter to a record $31 billion, led by funds listed in Europe and North America. Market surveys show that despite the decline in gold prices in September, global gold ETF holdings bucked the trend, increasing by 67 tons to a record high of 4,256 tons. This "buying on dips" phenomenon has attracted significant market attention—despite the triple headwinds of gold price corrections, soaring US Treasury yields, and a strengthening dollar, ETF funds maintained net inflows every trading day, reflecting that long-term investors are viewing price corrections as strategic buying opportunities rather than signals of a trend reversal. The World Gold Council's 2026 Central Bank Gold Reserves Survey shows that 89% of surveyed central banks expect global central bank gold reserves to continue increasing over the next 12 months, and 45% expect their own gold reserves to increase, both record highs for the survey. Over the past four years, global central banks have purchased an average of approximately 1,000 tons of gold annually, significantly higher than the previous decade's average of around 500 tons per year. Goldman Sachs predicts that by the end of 2027, almost all of the approximately 23% increase in gold prices will be driven by central bank demand, with its tracking model showing a current global central bank gold purchase rate of approximately 91 tons per month. However, the Federal Reserve's hawkish stance and the resilience of US economic data constitute the main forces currently suppressing gold price increases. In his latest speech, St. Louis Fed President Mussaliem explicitly stated that "more monetary policy tightening" is needed to bring inflation back to the 2% target level, while emphasizing that the US economy is "quite strong" and the job market is "balanced and stable." Market surveys, using the CME FedWatch Tool, show that traders expect a 17.7% probability of a rate hike in October, but price in an 84.1% probability of at least a 25 basis point rate hike in December. A tracking index of Federal Reserve officials' speeches showed that Musalaem's hawkish rating for this speech was 7.3, roughly in line with his historical average of 7.2. While the Fed sentiment index dipped slightly by 0.25 points to 138.33, it remained firmly above the neutral benchmark of 100, indicating that overall policy communication remained significantly hawkish. This week, the market will face a dense test of several key economic data releases. The US September Consumer Price Index will be released on Wednesday, followed by the Producer Price Index and retail sales data on Thursday. If the inflation reading is stronger than expected, it could trigger a hawkish repricing of the Fed's interest rate path, pushing the dollar and US Treasury yields higher, putting new pressure on dollar-denominated gold. Conversely, weaker data could alleviate concerns about interest rate hikes, providing additional upward momentum for precious metals. It is worth noting that the dollar index rose 0.12% on Friday, closing at 102.23, and has risen approximately 0.3% this week, marking its fourth consecutive week of gains, the longest winning streak since May 2025. The 10-year US Treasury yield remains near a multi-year high of 5.24%, significantly increasing the opportunity cost of holding non-interest-bearing gold. Strategists at TD Securities point out that trend-following funds are adjusting their holdings in precious metals. "Commodity trading advisors are covering their short positions in gold and platinum," with short covering accounting for approximately 7% of their historically largest holdings, reflecting a shift in systemic funds' attitude towards precious metals towards a more supportive direction. TD Securities believes that "geopolitical risks, fiscal concerns, dollar depreciation, de-dollarization, and stagflation concerns remain the main factors supporting these funds flowing into gold," and predicts that "gold is setting the stage for further decoupling from real interest rates and initiating a new bull market extending into 2027." From a technical perspective, gold prices have shown signs of stabilization after a significant correction on the daily chart, but are still trading below the 20-day Bollinger Band middle line, indicating that the overall weak structure has not yet fully reversed. The 14-period Relative Strength Index (RSI) has risen to around 47, below the 50 neutral line, indicating that sellers still have some advantage, but downward momentum is weakening. The lower Bollinger Band at around $4055 forms a strong support zone. If gold prices fall further to this area, bargain hunting is expected. On the upside, the 20-day Bollinger Band middle line at around $4225 forms the first key resistance level, followed by the 100-day simple moving average at around $4255. Only a recapture of these two areas could significantly alleviate the weakness on the daily chart. Further strong resistance lies near the upper Bollinger Band at around $4400. Looking at the 4-hour chart, after rebounding from the low near $4066, the 5-day, 10-day, and 20-day moving averages have all turned upwards. The MACD indicator's DIFF has crossed above the DEA, forming a golden cross, and the red bars are expanding, indicating some short-term bullish momentum. Last week, gold prices briefly broke through the downtrend line, but strong resistance remains in the $4225-$4235 area. An upward trend line has formed on the hourly chart, reflecting the current bullish momentum. If gold prices pull back, they may find support in the $4165-$4170 range. Overall, until the strong resistance above $4230 is effectively broken, the rebound should still be considered a technical correction rather than a trend reversal. Editor's Summary: The gold market is currently at a critical juncture where bullish and bearish forces are fiercely clashing. Record inflows into global gold ETFs, continued central bank gold purchases, and renewed escalation of geopolitical risks in the Middle East together form a three-tiered protective system for gold prices. Data from the World Gold Council shows that even in an environment of high interest rates and a strong dollar, allocation-oriented funds are still increasing their holdings against the trend, indicating that the market pricing logic has shifted from the traditional "interest rate driven" to a more diversified framework of "credit hedging + reserve diversification." However, the persistence of the Federal Reserve's hawkish stance, the high level of US Treasury yields, and the uncertainty surrounding this week's key CPI data still set a ceiling for a short-term rebound in gold prices. Looking ahead, the direction of gold prices will depend on the evolution of three core variables: whether Wednesday's CPI data can alleviate market concerns about sticky inflation, whether the situation in the Middle East will escalate further into a wider energy supply disruption, and whether subsequent speeches by Federal Reserve officials will signal a slowdown in the pace of interest rate hikes. If CPI data is weak and geopolitical risks escalate, gold prices are expected to break through $4,230 and challenge the $4,300 to $4,400 range; conversely, if inflation data is strong and hawkish expectations from the Federal Reserve solidify further, gold prices may fall back to around $4,100 or even $4,060 to seek support.
- Risk Warning and Disclaimer
- The market involves risk, and trading may not be suitable for all investors. This article is for reference only and does not constitute personal investment advice, nor does it take into account certain users’ specific investment objectives, financial situation, or other needs. Any investment decisions made based on this information are at your own risk.