The pullback in US Treasury yields from their highs led to a decline in the US dollar index from its year-to-date high.
2026-10-12 15:30:19
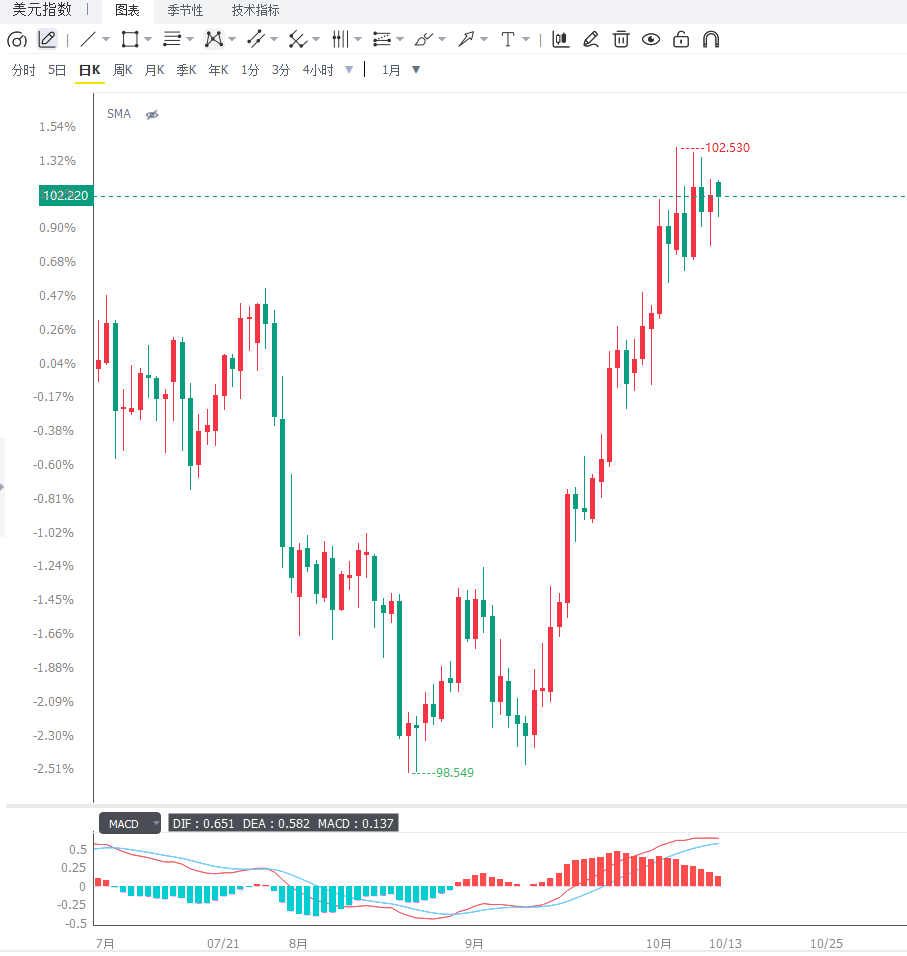
The US dollar index saw a mild pullback in the first trading session of the new week, trading between 102.00 and 102.20 in Asian trading on Monday, opening at 102.30 before declining slightly. Last week, the dollar index touched 102.55, its highest level since April 2025, marking its fourth consecutive week of gains and a year-to-date increase of 4.03%. However, Monday's pullback reflects more of a short-term pressure from a technical retreat in US Treasury yields than a fundamental reversal of the dollar's bullish trend.  The core catalyst driving the pullback in US Treasury yields from their highs came from the marginal easing of geopolitical tensions. US President Trump announced over the weekend that Russia and Ukraine had agreed to an "energy ceasefire," with both sides pledging not to attack each other's energy infrastructure. Previously, Trump had also announced an agreement with Russian President Putin for Russia to supply diesel to the global market in phases—an initial shipment of over 300,000 tons immediately, followed by another 500,000 tons in November, and a subsequent 1 million tons. This news directly eased concerns about global energy supply shortages, causing WTI crude oil prices to fall by about 2% in Asian trading on Monday, retreating to around $89, while Brent crude simultaneously fell from above $104. As a result, the 10-year US Treasury yield fell from 5.36%—the highest level since 2002—to approximately 5.22% to 5.24%. As one of the core drivers of the dollar's exchange rate, the decline in real US Treasury yields directly compressed the dollar's interest rate advantage, weakened the attractiveness of short positions in non-US currencies, and pushed the dollar index back from its year-to-date high. However, the downside potential of the dollar is also constrained by multiple factors. The Federal Reserve's policy expectations remain the strongest foundation supporting the dollar. The minutes of the September FOMC meeting released last week confirmed that most policymakers believed further rate hikes before the end of the year were likely appropriate. Although officials disagreed on the rationale for raising rates—some believed it was necessary to guard against the broader impact of energy and other price shocks, while more hawkish core officials believed it was necessary to guard against emerging demand-driven inflation—the overall tone was clearly hawkish. Kansas City Fed President Schmid further emphasized that even if higher long-term yields dragged down activity in some sectors of the economy, the Fed still needed to further raise policy rates to reduce inflation. St. Louis Fed President Musaleem stated that "more monetary policy tightening" was needed to bring inflation back to the 2% target, and that the US economy was "quite strong" and the job market was "balanced and stable." The CME FedWatch Tool showed that the market priced in at least a 25 basis point rate hike in October at about 17.7%, a slight decrease from a week ago, but the probability of a December rate hike remained as high as 84.1%, indicating that market expectations for further policy tightening this year remain strong. The resilience of US economic data also provided fundamental support for the US dollar. Analysts at Nordea Bank pointed out that the latest US ISM services data showed renewed price pressures, with the "price index" rising to its highest level since July 2022, while the "employment index returned to expansion territory." This combination means that although the US job market has shown some signs of cooling (non-farm payrolls increased by only 29,000 in September), demand in the service sector and inflationary pressures are still expanding, providing ample justification for the Federal Reserve to maintain its restrictive policy. While the University of Michigan consumer sentiment index fell to a five-month low of 46.3, one-year inflation expectations rose to 4.7%, and five- to ten-year inflation expectations rose to 3.5%, both reaching five-month highs, further solidifying the Fed's policy logic of "keeping interest rates high for longer." Geopolitical risks are also a significant force supporting the safe-haven demand for the US dollar. The situation in the Middle East has not eased due to the Russia-Ukraine "energy ceasefire." Iran's top security official announced that Washington's response to its proposal to reopen the Strait of Hormuz was "insufficient," and Trump is considering joining Saudi Arabia in military retaliation against the Houthis and resuming strikes against Iran. It's worth noting that the US markets were closed for Columbus Day, resulting in lighter liquidity in the US Treasury market and limited price discovery, potentially amplifying short-term volatility. However, this also means the current pullback may not be a trend indicator. Brown Brothers Harriman, in its latest report, points out that persistently high energy prices will push up inflation expectations through cost-push mechanisms, reinforcing the pricing of "higher" policy rates and pushing up the benchmark bond yield curve. This transmission chain provides dual support for the US dollar: on the one hand, the widening real interest rate and interest rate differential attract carry trade funds back to the dollar; on the other hand, relatively strong US economic growth, with output gaps and a resilient job market reducing recession pricing, and continued strong demand from overseas investors for US securities assets, with net capital inflows providing sustained structural buying for the dollar. ING also believes the dollar remains well-supported. From a fundamental perspective, continued uncertainty in the European geopolitical situation suppresses risk premiums for currencies like the euro, and safe-haven flows are expected to continue tilting towards the dollar in the coming months. On the demand side, the US 10-year Treasury auction performed well, with both bid-to-cover ratios and indirect bid volumes at high levels, indicating that market demand for US Treasuries remains. ING expects the US dollar index to gradually rise and test the target level of 102.85. However, Goldman Sachs, in its latest report, is cautious about further short-term strengthening of the dollar. The bank points out that the recent surge in US interest rates may have exceeded what fundamentals can explain, and a meaningful rebound in US Treasuries may depend on lower energy prices or weaker economic growth data. Goldman Sachs believes there are five drivers of the US Treasury sell-off: still loose financial conditions, spillover effects from oil-price-driven European bond sell-offs, strong US data, weak Treasury auctions, and technical portfolio flows. The bank's assessment is that the move may have overshot, but the catalyst for a rebound may come from outside the bond market—lower energy prices or weaker growth data. This means that with Brent crude oil remaining near $100/barrel, ongoing Middle East supply disruptions, and the Fed's September rate hike, the conditions for a significant rebound in US Treasuries are not yet in place, but marginal adjustment risks are accumulating. This week, the market will face a whirlwind of key data releases. US September PPI and CPI data will be released on Wednesday and Thursday respectively, directly impacting market pricing in the Federal Reserve's interest rate path. Strong CPI data could push up expectations of a December rate hike, supporting the dollar index to challenge its year-to-date highs; weaker data could ease rate hike concerns and push the dollar further down. Federal Reserve Chairman Warsh is scheduled to speak at the IMF and World Bank annual meetings in Bangkok on Friday, and the market will closely watch his latest assessment of the inflation outlook and policy path. Standard Chartered's Chief Investment Office, in its fourth-quarter outlook, predicts that the dollar will remain supported in the short term, with a target of 100.2 for the dollar index in the next three months and a 12-month decline to 98. Short-term support comes from the possibility of further tightening by the Fed and the resilience of the US economy, while medium- to long-term support comes from the fading impact of oil prices and tariffs, easing inflationary pressures, and the narrowing interest rate advantage due to continued tightening by the ECB and the Bank of Japan. From a technical perspective, the dollar index's range-bound trading over the past week on the daily chart can be defined as a bullish consolidation phase within a strong upward trend. The exchange rate is trading steadily above the 200-day simple moving average and the Bollinger Band middle line, indicating that the medium-term bullish structure remains intact and the previous upward channel is still complete. The 14-day Relative Strength Index (RSI) is around 70.67, approaching the overbought zone, suggesting strong upward momentum but potential short-term profit-taking and a technical pullback. While the MACD indicator is releasing a bearish signal, it remains above the zero line, with the red bars narrowing and the fast and slow lines showing signs of convergence, indicating gradually weakening upward momentum but not yet turning negative. The Bollinger Bands remain open upwards, with the upper band forming strong resistance at 102.54. The middle Bollinger Band at approximately 101.24 provides significant medium-term support. Regarding resistance, the year's high of 102.55 is a key resistance level for this upward move, having been tested multiple times without a decisive breakthrough, resulting in a large accumulation of profit-taking. If this level cannot be held, the market is likely to enter a period of high-level consolidation; a break above this level could lead to a further challenge of the 103.00 psychological level. ING's more optimistic target is 102.85. On the downside, the 101.70 to 101.80 area is a support level that has transformed from a previous resistance breakout, and Friday's technical pullback found support in this area. Next is around 101.40, with stronger support at the psychological level of 101.00. Looking at the 4-hour chart, the index is fluctuating around the 102.00 level, with short-term moving averages remaining upward and the price consistently trading above major moving averages, indicating a continued bullish short-term trend. Short-term momentum indicators have rebounded after falling from their highs. If this week's data pushes the index above 102.55, the upward trend will be confirmed, opening up further upside potential; conversely, if the data is dovish, a pullback to test the 101.70 to 101.80 support zone may occur. The daily chart's PP pivot point is at 102.156, corresponding to a maximum support/resistance range of 101.563 to 102.823.
  Editor's Summary: The US dollar index is currently in a typical transitional phase between a "short-term technical correction" and an "unbroken medium-term bullish structure." The decline in oil prices and the pullback in US Treasury yields following the Russia-Ukraine "energy ceasefire" have put short-term profit-taking pressure on the dollar. However, the persistence of the Fed's hawkish stance, the resilience of US economic data, the safe-haven support from Middle East geopolitical risks, and the suppression of non-US currencies by European fiscal concerns collectively constitute a multi-layered protective system for the dollar index. Looking ahead, the short-term direction will depend on three core variables: whether this week's US CPI/PPI data can change market pricing in the Fed's interest rate hike pace, the policy signals conveyed by Warsh's speech at the IMF annual meeting, and the further impact of the Middle East situation on energy prices and risk sentiment. If strong CPI data is coupled with escalating geopolitical risks, the dollar index is expected to retest the year's high of 102.55 and launch an attack on 103.00; conversely, if the data is weak and oil prices continue to fall, the index may consolidate in the 101.70 to 101.40 range.
The core catalyst driving the pullback in US Treasury yields from their highs came from the marginal easing of geopolitical tensions. US President Trump announced over the weekend that Russia and Ukraine had agreed to an "energy ceasefire," with both sides pledging not to attack each other's energy infrastructure. Previously, Trump had also announced an agreement with Russian President Putin for Russia to supply diesel to the global market in phases—an initial shipment of over 300,000 tons immediately, followed by another 500,000 tons in November, and a subsequent 1 million tons. This news directly eased concerns about global energy supply shortages, causing WTI crude oil prices to fall by about 2% in Asian trading on Monday, retreating to around $89, while Brent crude simultaneously fell from above $104. As a result, the 10-year US Treasury yield fell from 5.36%—the highest level since 2002—to approximately 5.22% to 5.24%. As one of the core drivers of the dollar's exchange rate, the decline in real US Treasury yields directly compressed the dollar's interest rate advantage, weakened the attractiveness of short positions in non-US currencies, and pushed the dollar index back from its year-to-date high. However, the downside potential of the dollar is also constrained by multiple factors. The Federal Reserve's policy expectations remain the strongest foundation supporting the dollar. The minutes of the September FOMC meeting released last week confirmed that most policymakers believed further rate hikes before the end of the year were likely appropriate. Although officials disagreed on the rationale for raising rates—some believed it was necessary to guard against the broader impact of energy and other price shocks, while more hawkish core officials believed it was necessary to guard against emerging demand-driven inflation—the overall tone was clearly hawkish. Kansas City Fed President Schmid further emphasized that even if higher long-term yields dragged down activity in some sectors of the economy, the Fed still needed to further raise policy rates to reduce inflation. St. Louis Fed President Musaleem stated that "more monetary policy tightening" was needed to bring inflation back to the 2% target, and that the US economy was "quite strong" and the job market was "balanced and stable." The CME FedWatch Tool showed that the market priced in at least a 25 basis point rate hike in October at about 17.7%, a slight decrease from a week ago, but the probability of a December rate hike remained as high as 84.1%, indicating that market expectations for further policy tightening this year remain strong. The resilience of US economic data also provided fundamental support for the US dollar. Analysts at Nordea Bank pointed out that the latest US ISM services data showed renewed price pressures, with the "price index" rising to its highest level since July 2022, while the "employment index returned to expansion territory." This combination means that although the US job market has shown some signs of cooling (non-farm payrolls increased by only 29,000 in September), demand in the service sector and inflationary pressures are still expanding, providing ample justification for the Federal Reserve to maintain its restrictive policy. While the University of Michigan consumer sentiment index fell to a five-month low of 46.3, one-year inflation expectations rose to 4.7%, and five- to ten-year inflation expectations rose to 3.5%, both reaching five-month highs, further solidifying the Fed's policy logic of "keeping interest rates high for longer." Geopolitical risks are also a significant force supporting the safe-haven demand for the US dollar. The situation in the Middle East has not eased due to the Russia-Ukraine "energy ceasefire." Iran's top security official announced that Washington's response to its proposal to reopen the Strait of Hormuz was "insufficient," and Trump is considering joining Saudi Arabia in military retaliation against the Houthis and resuming strikes against Iran. It's worth noting that the US markets were closed for Columbus Day, resulting in lighter liquidity in the US Treasury market and limited price discovery, potentially amplifying short-term volatility. However, this also means the current pullback may not be a trend indicator. Brown Brothers Harriman, in its latest report, points out that persistently high energy prices will push up inflation expectations through cost-push mechanisms, reinforcing the pricing of "higher" policy rates and pushing up the benchmark bond yield curve. This transmission chain provides dual support for the US dollar: on the one hand, the widening real interest rate and interest rate differential attract carry trade funds back to the dollar; on the other hand, relatively strong US economic growth, with output gaps and a resilient job market reducing recession pricing, and continued strong demand from overseas investors for US securities assets, with net capital inflows providing sustained structural buying for the dollar. ING also believes the dollar remains well-supported. From a fundamental perspective, continued uncertainty in the European geopolitical situation suppresses risk premiums for currencies like the euro, and safe-haven flows are expected to continue tilting towards the dollar in the coming months. On the demand side, the US 10-year Treasury auction performed well, with both bid-to-cover ratios and indirect bid volumes at high levels, indicating that market demand for US Treasuries remains. ING expects the US dollar index to gradually rise and test the target level of 102.85. However, Goldman Sachs, in its latest report, is cautious about further short-term strengthening of the dollar. The bank points out that the recent surge in US interest rates may have exceeded what fundamentals can explain, and a meaningful rebound in US Treasuries may depend on lower energy prices or weaker economic growth data. Goldman Sachs believes there are five drivers of the US Treasury sell-off: still loose financial conditions, spillover effects from oil-price-driven European bond sell-offs, strong US data, weak Treasury auctions, and technical portfolio flows. The bank's assessment is that the move may have overshot, but the catalyst for a rebound may come from outside the bond market—lower energy prices or weaker growth data. This means that with Brent crude oil remaining near $100/barrel, ongoing Middle East supply disruptions, and the Fed's September rate hike, the conditions for a significant rebound in US Treasuries are not yet in place, but marginal adjustment risks are accumulating. This week, the market will face a whirlwind of key data releases. US September PPI and CPI data will be released on Wednesday and Thursday respectively, directly impacting market pricing in the Federal Reserve's interest rate path. Strong CPI data could push up expectations of a December rate hike, supporting the dollar index to challenge its year-to-date highs; weaker data could ease rate hike concerns and push the dollar further down. Federal Reserve Chairman Warsh is scheduled to speak at the IMF and World Bank annual meetings in Bangkok on Friday, and the market will closely watch his latest assessment of the inflation outlook and policy path. Standard Chartered's Chief Investment Office, in its fourth-quarter outlook, predicts that the dollar will remain supported in the short term, with a target of 100.2 for the dollar index in the next three months and a 12-month decline to 98. Short-term support comes from the possibility of further tightening by the Fed and the resilience of the US economy, while medium- to long-term support comes from the fading impact of oil prices and tariffs, easing inflationary pressures, and the narrowing interest rate advantage due to continued tightening by the ECB and the Bank of Japan. From a technical perspective, the dollar index's range-bound trading over the past week on the daily chart can be defined as a bullish consolidation phase within a strong upward trend. The exchange rate is trading steadily above the 200-day simple moving average and the Bollinger Band middle line, indicating that the medium-term bullish structure remains intact and the previous upward channel is still complete. The 14-day Relative Strength Index (RSI) is around 70.67, approaching the overbought zone, suggesting strong upward momentum but potential short-term profit-taking and a technical pullback. While the MACD indicator is releasing a bearish signal, it remains above the zero line, with the red bars narrowing and the fast and slow lines showing signs of convergence, indicating gradually weakening upward momentum but not yet turning negative. The Bollinger Bands remain open upwards, with the upper band forming strong resistance at 102.54. The middle Bollinger Band at approximately 101.24 provides significant medium-term support. Regarding resistance, the year's high of 102.55 is a key resistance level for this upward move, having been tested multiple times without a decisive breakthrough, resulting in a large accumulation of profit-taking. If this level cannot be held, the market is likely to enter a period of high-level consolidation; a break above this level could lead to a further challenge of the 103.00 psychological level. ING's more optimistic target is 102.85. On the downside, the 101.70 to 101.80 area is a support level that has transformed from a previous resistance breakout, and Friday's technical pullback found support in this area. Next is around 101.40, with stronger support at the psychological level of 101.00. Looking at the 4-hour chart, the index is fluctuating around the 102.00 level, with short-term moving averages remaining upward and the price consistently trading above major moving averages, indicating a continued bullish short-term trend. Short-term momentum indicators have rebounded after falling from their highs. If this week's data pushes the index above 102.55, the upward trend will be confirmed, opening up further upside potential; conversely, if the data is dovish, a pullback to test the 101.70 to 101.80 support zone may occur. The daily chart's PP pivot point is at 102.156, corresponding to a maximum support/resistance range of 101.563 to 102.823. Editor's Summary: The US dollar index is currently in a typical transitional phase between a "short-term technical correction" and an "unbroken medium-term bullish structure." The decline in oil prices and the pullback in US Treasury yields following the Russia-Ukraine "energy ceasefire" have put short-term profit-taking pressure on the dollar. However, the persistence of the Fed's hawkish stance, the resilience of US economic data, the safe-haven support from Middle East geopolitical risks, and the suppression of non-US currencies by European fiscal concerns collectively constitute a multi-layered protective system for the dollar index. Looking ahead, the short-term direction will depend on three core variables: whether this week's US CPI/PPI data can change market pricing in the Fed's interest rate hike pace, the policy signals conveyed by Warsh's speech at the IMF annual meeting, and the further impact of the Middle East situation on energy prices and risk sentiment. If strong CPI data is coupled with escalating geopolitical risks, the dollar index is expected to retest the year's high of 102.55 and launch an attack on 103.00; conversely, if the data is weak and oil prices continue to fall, the index may consolidate in the 101.70 to 101.40 range.
- Risk Warning and Disclaimer
- The market involves risk, and trading may not be suitable for all investors. This article is for reference only and does not constitute personal investment advice, nor does it take into account certain users’ specific investment objectives, financial situation, or other needs. Any investment decisions made based on this information are at your own risk.