Why didn't gold prices rise in tandem with the influx of $31 billion into gold ETFs?
2026-10-12 16:00:17
On Monday, October 12th, spot gold was caught in a tug-of-war between allocation needs and interest rate constraints, currently trading around $4180 per ounce. The US dollar index fell slightly to around 102.20 that day, but remained near an 18-month high; declining energy prices and uncertainty surrounding regional conflicts simultaneously impacted risk premiums. More notably, while gold ETF holdings hit record highs, gold prices retreated significantly in September, indicating that market pricing did not simply follow the flow of funds. 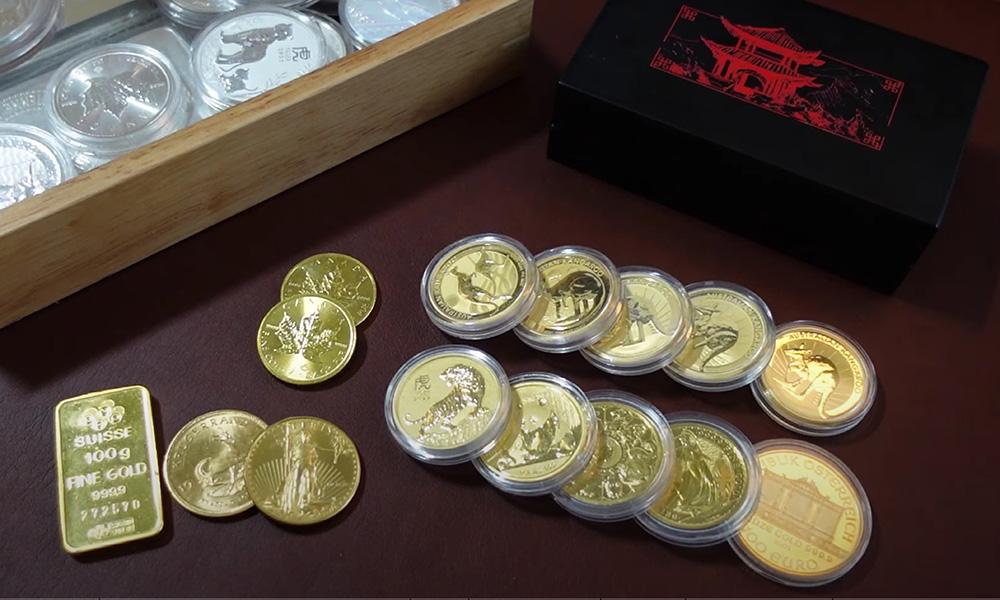
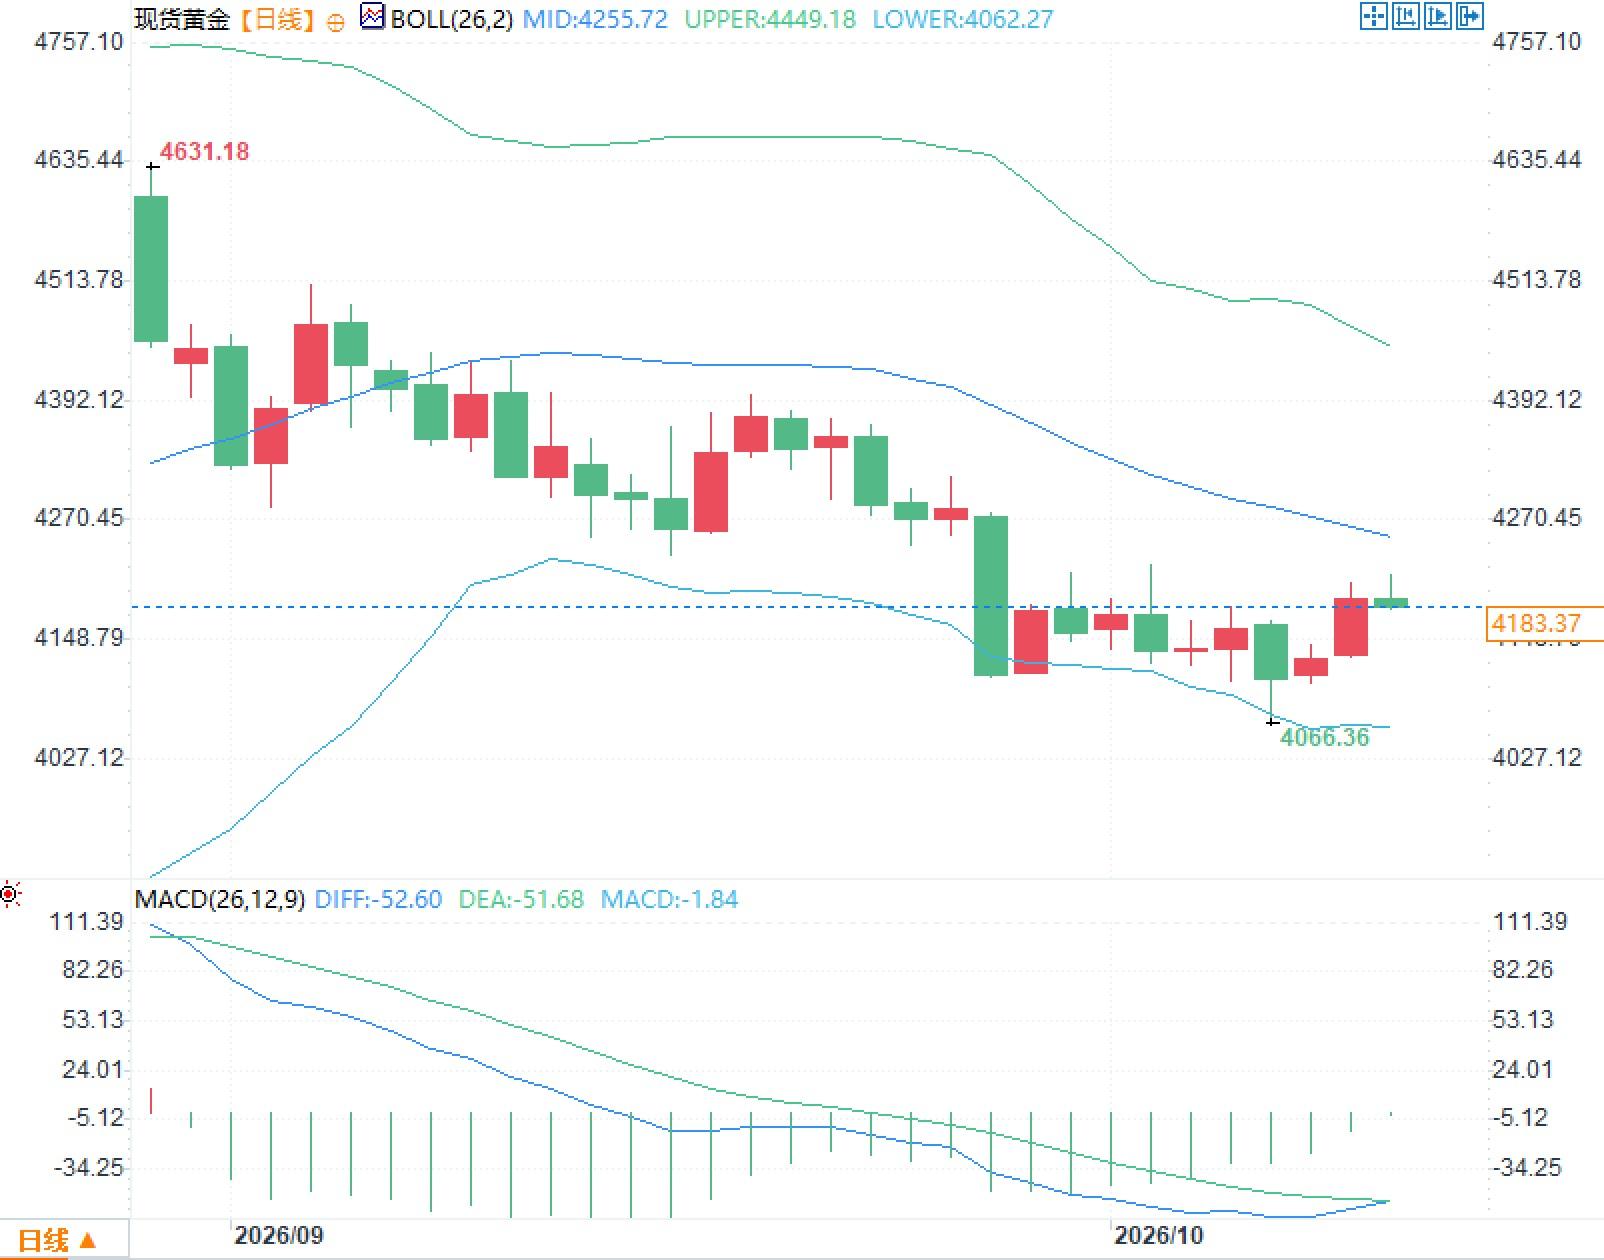 In the MACD indicator, the fast line reading is -52.60, the slow line is -51.68, and the histogram value is -1.84. The negative histogram has shortened significantly, indicating that the negative difference between the two lines is converging; however, both lines are still below the zero axis, so weakening momentum cannot be directly equated with a trend reversal. Further analysis requires distinguishing between technical corrections caused by decreased volatility, price covering, and reduced positions. In particular, when net long positions in futures decrease while ETF holdings increase, short-term price fluctuations and medium- to long-term allocation behaviors may be driven by different factors.
Gold ETFs hit record highs, but why didn't gold prices rise in tandem?
Data released by the World Gold Council on October 7 showed that global physical gold ETFs saw net inflows of $10 billion in September, bringing the cumulative net inflows for the third quarter to a record $31 billion. Holdings increased by 67 tons to 4,256 tons in September, but assets under management decreased by 7% month-on-month to $574 billion. This is not a statistical contradiction: fund size is affected by both subscriptions and redemptions, as well as the revaluation of the market value of gold holdings. Gold prices fell by 8.5% in September according to their statistical methodology, and this price factor was sufficient to offset some of the contribution of new funds to asset size. The fund structure further reveals the divergence. During the same period, net long positions in the gold futures market decreased by approximately 84 tons, and net long positions across all categories fell by 13% to 654 tons. ETF subscriptions typically reflect asset allocation and holding needs, while futures position adjustments are more sensitive to margin requirements, leverage, and risk budgets. Increases in the former and deleveraging in the latter can occur simultaneously, even leading to increased holdings by physically backed funds while marginal pricing comes under pressure. Therefore, the $31 billion in inflow should not be mechanically interpreted as an equivalent amount of immediate spot buying, nor can it be used as a sole basis for trend conclusions. Gold market price formation depends on marginal transactions between different participants; there is no necessary correlation between total open interest and short-term price performance.Interest rates, the US dollar, and energy prices form a triple transmission mechanism.
Gold has no coupon rate, and its relative attractiveness is influenced by real interest rates, the US dollar exchange rate, and safe-haven demand. Data from the World Gold Council shows that the yield on the 10-year US Treasury note rose 53 basis points to 5.3% in September, while the US dollar index rose by about 2% for the month. Rising nominal yields increase the comparative cost of holding non-interest-bearing assets, but if inflation expectations rise simultaneously, changes in real interest rates may not align with nominal yields. These are two variables that must be distinguished when analyzing gold. As of October 12th, interest rate futures reflected a 17% probability of a Fed rate hike in October, and a cumulative probability of a rate hike by December of about 86%. These correspond to different decision-making timeframes and should not be interpreted as contradictory predictions from the same meeting. The US will release its September Consumer Price Index on October 14th and its Producer Price Index on October 15th. The market's focus is not on individual inflation figures, but on whether rising energy prices are being passed on to core services, wage costs, and long-term inflation expectations. Especially after the significant rise in bond yields in the previous period, changes in the inflation structure and real interest rates are more explanatory than simply observing the year-on-year inflation rate.Daily Indicator Observation
On the daily chart, the Bollinger Band middle line continues to decline, and recent candlesticks have mainly been below the middle line, indicating that the average price formed over the past 26 trading days is still moving downwards. After the previous sharp pullback, the candlestick bodies have become smaller, reflecting that the exchange between bulls and bears has been more frequent in recent price fluctuations. In the MACD indicator, the fast line reading is -52.60, the slow line is -51.68, and the histogram value is -1.84. The negative histogram has shortened significantly, indicating that the negative difference between the two lines is converging; however, both lines are still below the zero axis, so weakening momentum cannot be directly equated with a trend reversal. Further analysis requires distinguishing between technical corrections caused by decreased volatility, price covering, and reduced positions. In particular, when net long positions in futures decrease while ETF holdings increase, short-term price fluctuations and medium- to long-term allocation behaviors may be driven by different factors.Frequently Asked Questions
Question 1: Why hasn't the continuous inflow into gold ETFs led to a synchronized price increase? Answer: Net inflows into ETFs measure changes in funds generated by fund share subscriptions, and do not represent a consistent increase in holdings by all gold market participants. The decrease in net long positions of futures managed funds in September, along with the rise in the US dollar and Treasury yields, also altered marginal pricing. Simultaneously, asset management scale is also affected by the market capitalization resulting from the decline in gold prices; therefore, it is necessary to observe holdings in tons, fund flows, and price performance separately. Question 2: Why is there such a significant difference between the probabilities of a Fed rate hike in October and December? Answer: 17% reflects the immediate probability of a rate hike at the October meeting, while 86% reflects the cumulative expectation of a rate hike by December. These are not two results that can be directly subtracted. Probabilities change with inflation data and interest rate futures prices; they are neither a policy commitment nor do they imply that action will necessarily be taken at a particular meeting.- Risk Warning and Disclaimer
- The market involves risk, and trading may not be suitable for all investors. This article is for reference only and does not constitute personal investment advice, nor does it take into account certain users’ specific investment objectives, financial situation, or other needs. Any investment decisions made based on this information are at your own risk.