Copper Price Forecast: Chilean Supply Risks Drive Record Highs into Market Focus
2026-10-12 19:36:19
Copper prices are recovering from a support level, with Chilean supply risks and US reserve stockpiling supporting the current rebound. However, high copper prices are keeping Chinese manufacturers cautious, while a strong US dollar will limit further price increases. The US inflation report to be released on Wednesday will likely determine the future direction of the dollar and interest rates. The copper-to-gold ratio is also rising, which is a signal worth noting. The author believes that the copper price rebound still has room to continue, but it must break through the $6.95 and $7.10 levels to further solidify the upward trend. This article analyzes the outlook for copper prices by outlining key market drivers, key technical levels, and the performance of the copper-gold ratio.  Copper Fundamentals: Chilean Supply Risks Support Copper Price Rebound Ahead of US CPI Release Emerging supply concerns in Chile are supporting copper prices. On Sunday, an accident occurred at Codelco's El Tennant copper mine; the mine's open-pit mine had already suspended production due to severe weather. Meanwhile, the labor strike at the Sentinela copper mine continues. The company stated that labor negotiations will resume on October 13; the mine will continue to operate during the strike, but with limited capacity. Continued production disruptions at copper mines will benefit copper prices, while a settlement between labor and management would alleviate market supply anxieties. Purchases from China are mixed. Last Friday, the copper import premium at Yangshan Port reached $135 per ton; increased imports and Shanghai copper inventories rising to 66,500 tons eased domestic supply pressure. However, high prices have made manufacturers very cautious, with producers currently only purchasing on an immediate, need-based basis. This means that relying solely on strong import demand will make it difficult to sustain the current copper price rebound. US stockpiling is also impacting global copper supply. Market concerns about changes in import tariffs have prompted continued copper inflows into the United States. Last Friday, copper inventories on the London Metal Exchange (LME) fell to 233,025 tons, a six-week low. The author believes that if the US continues to purchase copper, global copper supply will remain tight; however, this support will weaken once the pace of stockpiling slows. A strong dollar is a potential risk to copper price recovery. On Monday, the dollar index approached an 18-month high, with the market awaiting Wednesday's US CPI data. If inflation data is exceptionally high, the market will strengthen expectations of continued Fed rate hikes, pushing the dollar higher. A stronger dollar will increase the cost of copper purchases for overseas buyers, and high borrowing costs will suppress industrial demand; conversely, if inflation weakens, these pressures will ease. Copper price forecast: A break above $7.10 could lead to a move towards $7.50.
 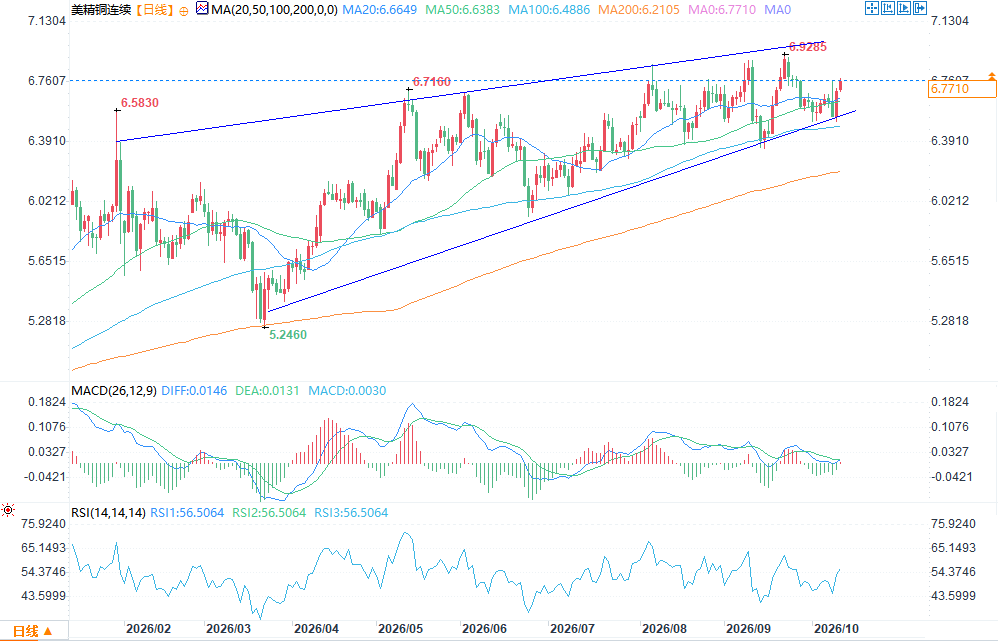 (COMEX Copper Index Source: EasyForex) Looking at the daily chart, copper prices found strong support at $6.50 and surged on Friday, closing at $6.76. This rebound released a strong bullish signal, and copper prices are expected to retest the historical high of $6.95. This rebound started from the strong support level of the rising wedge pattern. If the price effectively breaks above $6.95, it will further challenge the wedge pattern resistance level of $7.10. The Relative Strength Index (RSI) has risen above the midline and continues to rise, indicating a bullish short-term trend. The overall bullish pattern for copper prices is solid in the short term, with prices consolidating in the $6.50-$6.95 range. Currently, it has regained its position above the 50-day Simple Moving Average (SMA) and is approaching the $6.95 level. A break above $6.95 would open up further upside potential; a break below $6.50 would see prices test the 200-day Simple Moving Average near $6.20. As long as copper prices hold above $6 in the short term, the probability of them hitting $7.50 remains high. Quarterly charts show copper in a clear upward trend with no immediate signs of a pullback; current prices are encountering resistance at the key resistance zone of the $6.50-$7.00 upward channel. A break above $7.10 would strongly favor a move towards $7.50. The upward channel extending from the July 2002 low establishes $6 as a core support level for copper prices. Copper-Gold Ratio: Watch for breakout signals during a rebound . The monthly chart also confirms the bullish logic. Copper prices tested major bottoms twice, in 2009 and 2020, and broke out of the consolidation range in 2025, currently trading at $6.79, holding above the previous resistance line. Despite facing strong resistance at $7.10, the overall upward trend remains solid. The US dollar index has rebounded to 102.3, but has not yet broken through the downtrend line since September 2022. If prices encounter resistance at this trendline and fall back, a weaker dollar will reduce procurement costs for overseas buyers, benefiting copper prices; conversely, if the dollar breaks through, copper prices will face increased pressure. However, since June 2025, affected by supply disruptions and tariff uncertainties, copper prices have strengthened in tandem with the dollar. The copper-gold ratio rebounded from around 0.0011, near the lower edge of the descending wedge, rising to around 0.00163. The price increase reflects the improved performance of copper relative to gold, but it remains within the wedge pattern overall. The copper-gold ratio rose 6.82% in September, with the monthly candlestick showing a bullish candle, indicating that the ratio is likely to test the descending wedge resistance at 0.0020. A successful break above this level would confirm the strengthening of the ratio, proving that copper outperforms gold. If the ratio falls back to around the recent low of 0.0011, the current recovery will be weakened. The author believes that the significant rise in the copper-gold ratio in September suggests that copper will likely continue to outperform gold, thus providing further upward momentum for copper prices. What to Watch in the Copper Market Next? The outcome of the labor negotiations at the Sentinela copper mine and Wednesday's US inflation report will determine the next direction of copper prices. If the strike continues, the market will remain concerned about a supply gap; if inflation cools, the pressure from the dollar and interest rates will ease. Conversely, a strike settlement or better-than-expected inflation data will suppress copper price increases. The key upside resistance level is $6.95; a break above this level would target $7.10; a sustained hold above $7.10 would open the door to $7.50. A break below $6.50 would weaken the current rebound, with prices testing support around $6.20. Chinese purchasing demand and the copper-gold ratio are also worth monitoring. A recovery in manufacturing demand will provide strong support for copper prices; a copper-gold ratio break above 0.0020 would further confirm copper's strength relative to gold. Overall, the general trend for copper prices remains positive, but only by overcoming the resistance levels of $6.95 and $7.10 can this upward trend be sustained.
Copper Fundamentals: Chilean Supply Risks Support Copper Price Rebound Ahead of US CPI Release Emerging supply concerns in Chile are supporting copper prices. On Sunday, an accident occurred at Codelco's El Tennant copper mine; the mine's open-pit mine had already suspended production due to severe weather. Meanwhile, the labor strike at the Sentinela copper mine continues. The company stated that labor negotiations will resume on October 13; the mine will continue to operate during the strike, but with limited capacity. Continued production disruptions at copper mines will benefit copper prices, while a settlement between labor and management would alleviate market supply anxieties. Purchases from China are mixed. Last Friday, the copper import premium at Yangshan Port reached $135 per ton; increased imports and Shanghai copper inventories rising to 66,500 tons eased domestic supply pressure. However, high prices have made manufacturers very cautious, with producers currently only purchasing on an immediate, need-based basis. This means that relying solely on strong import demand will make it difficult to sustain the current copper price rebound. US stockpiling is also impacting global copper supply. Market concerns about changes in import tariffs have prompted continued copper inflows into the United States. Last Friday, copper inventories on the London Metal Exchange (LME) fell to 233,025 tons, a six-week low. The author believes that if the US continues to purchase copper, global copper supply will remain tight; however, this support will weaken once the pace of stockpiling slows. A strong dollar is a potential risk to copper price recovery. On Monday, the dollar index approached an 18-month high, with the market awaiting Wednesday's US CPI data. If inflation data is exceptionally high, the market will strengthen expectations of continued Fed rate hikes, pushing the dollar higher. A stronger dollar will increase the cost of copper purchases for overseas buyers, and high borrowing costs will suppress industrial demand; conversely, if inflation weakens, these pressures will ease. Copper price forecast: A break above $7.10 could lead to a move towards $7.50. (COMEX Copper Index Source: EasyForex) Looking at the daily chart, copper prices found strong support at $6.50 and surged on Friday, closing at $6.76. This rebound released a strong bullish signal, and copper prices are expected to retest the historical high of $6.95. This rebound started from the strong support level of the rising wedge pattern. If the price effectively breaks above $6.95, it will further challenge the wedge pattern resistance level of $7.10. The Relative Strength Index (RSI) has risen above the midline and continues to rise, indicating a bullish short-term trend. The overall bullish pattern for copper prices is solid in the short term, with prices consolidating in the $6.50-$6.95 range. Currently, it has regained its position above the 50-day Simple Moving Average (SMA) and is approaching the $6.95 level. A break above $6.95 would open up further upside potential; a break below $6.50 would see prices test the 200-day Simple Moving Average near $6.20. As long as copper prices hold above $6 in the short term, the probability of them hitting $7.50 remains high. Quarterly charts show copper in a clear upward trend with no immediate signs of a pullback; current prices are encountering resistance at the key resistance zone of the $6.50-$7.00 upward channel. A break above $7.10 would strongly favor a move towards $7.50. The upward channel extending from the July 2002 low establishes $6 as a core support level for copper prices. Copper-Gold Ratio: Watch for breakout signals during a rebound . The monthly chart also confirms the bullish logic. Copper prices tested major bottoms twice, in 2009 and 2020, and broke out of the consolidation range in 2025, currently trading at $6.79, holding above the previous resistance line. Despite facing strong resistance at $7.10, the overall upward trend remains solid. The US dollar index has rebounded to 102.3, but has not yet broken through the downtrend line since September 2022. If prices encounter resistance at this trendline and fall back, a weaker dollar will reduce procurement costs for overseas buyers, benefiting copper prices; conversely, if the dollar breaks through, copper prices will face increased pressure. However, since June 2025, affected by supply disruptions and tariff uncertainties, copper prices have strengthened in tandem with the dollar. The copper-gold ratio rebounded from around 0.0011, near the lower edge of the descending wedge, rising to around 0.00163. The price increase reflects the improved performance of copper relative to gold, but it remains within the wedge pattern overall. The copper-gold ratio rose 6.82% in September, with the monthly candlestick showing a bullish candle, indicating that the ratio is likely to test the descending wedge resistance at 0.0020. A successful break above this level would confirm the strengthening of the ratio, proving that copper outperforms gold. If the ratio falls back to around the recent low of 0.0011, the current recovery will be weakened. The author believes that the significant rise in the copper-gold ratio in September suggests that copper will likely continue to outperform gold, thus providing further upward momentum for copper prices. What to Watch in the Copper Market Next? The outcome of the labor negotiations at the Sentinela copper mine and Wednesday's US inflation report will determine the next direction of copper prices. If the strike continues, the market will remain concerned about a supply gap; if inflation cools, the pressure from the dollar and interest rates will ease. Conversely, a strike settlement or better-than-expected inflation data will suppress copper price increases. The key upside resistance level is $6.95; a break above this level would target $7.10; a sustained hold above $7.10 would open the door to $7.50. A break below $6.50 would weaken the current rebound, with prices testing support around $6.20. Chinese purchasing demand and the copper-gold ratio are also worth monitoring. A recovery in manufacturing demand will provide strong support for copper prices; a copper-gold ratio break above 0.0020 would further confirm copper's strength relative to gold. Overall, the general trend for copper prices remains positive, but only by overcoming the resistance levels of $6.95 and $7.10 can this upward trend be sustained.
- Risk Warning and Disclaimer
- The market involves risk, and trading may not be suitable for all investors. This article is for reference only and does not constitute personal investment advice, nor does it take into account certain users’ specific investment objectives, financial situation, or other needs. Any investment decisions made based on this information are at your own risk.