Gold futures long positions continued to decrease, while ETFs hit new highs. What does this divergence signify?
2026-10-13 15:00:18
On Tuesday, October 13th, spot gold prices were fluctuating between $4170 and $4190 per ounce, having rebounded slightly last week but still significantly lower than previous highs. Spot silver traded around $60 to $61 per ounce during the same period. This price consolidation occurred amid persistently high US Treasury yields and expectations of a tightening Federal Reserve policy. However, global gold ETFs attracted approximately $10 billion in inflows in September, bringing the total for the third quarter to a record $31 billion, with holdings rising to a historical high of 4256 tons. Leveraged futures continued to see a reduction in long positions. This week's focus is on the US September Consumer Price Index (CPI) to be released on October 14th, and the Producer Price Index (PPI) and retail sales data on the 15th. Conflicts in the Middle East have kept Brent crude oil prices above $105 per barrel, becoming a key variable in inflation expectations. 
Structural differentiation in capital flows
During price corrections, short-term traders reduced their positions, while physically backed ETFs continued to increase their holdings. Data from the World Gold Council shows that despite declining gold prices, global gold ETFs still recorded inflows of approximately $10 billion in September, with holdings increasing by about 67 tons to 4,256 tons. Inflows reached $31 billion in the third quarter, a phenomenon contrasting with the futures market. The latest CFTC report shows that net long positions in managed funds fell to approximately 111,000 contracts, declining for several consecutive weeks, reflecting the sensitive reaction of leveraged traders to short-term volatility. The divergence in investor behavior across different maturities indicates that long-term allocation demand has not retreated with price corrections. The accumulation of physical ETFs suggests that some funds are focusing on factors beyond a single policy meeting, such as rising debt costs and erosion of real purchasing power. Rapid reductions in futures positions can amplify short-term price volatility, while continuous inflows into ETFs provide underlying support during price weakness; the difference in time preferences between these two types of market participants constitutes the current structural characteristic.Macroeconomic environment and policy signals
The 10-year US Treasury yield is hovering around 5.2% to 5.24%, with real yields remaining relatively high. The Federal Reserve raised the target range for the federal funds rate to 3.75% to 4% at its September meeting, and the minutes showed that most participants believed another rate hike this year might be appropriate. The market assesses a low probability of a rate hike at the October meeting, but a delay does not equate to abandoning further tightening. The US dollar index is trading in the 102.3 to 102.4 range, rising for the fourth consecutive week. This week's US inflation data will test the sustainability of expectations for further tightening. Higher interest rates increase the relative attractiveness of government debt in the short term, while simultaneously increasing the servicing costs of existing debt. Continued inflation continues to erode the real purchasing power of savings, and a stronger dollar against other currencies does not necessarily mean a corresponding increase in purchasing power for goods and services. These structural factors, along with short-term policy expectations, collectively shape the pricing environment for precious metals.Technical Indicators and Volatility Characteristics
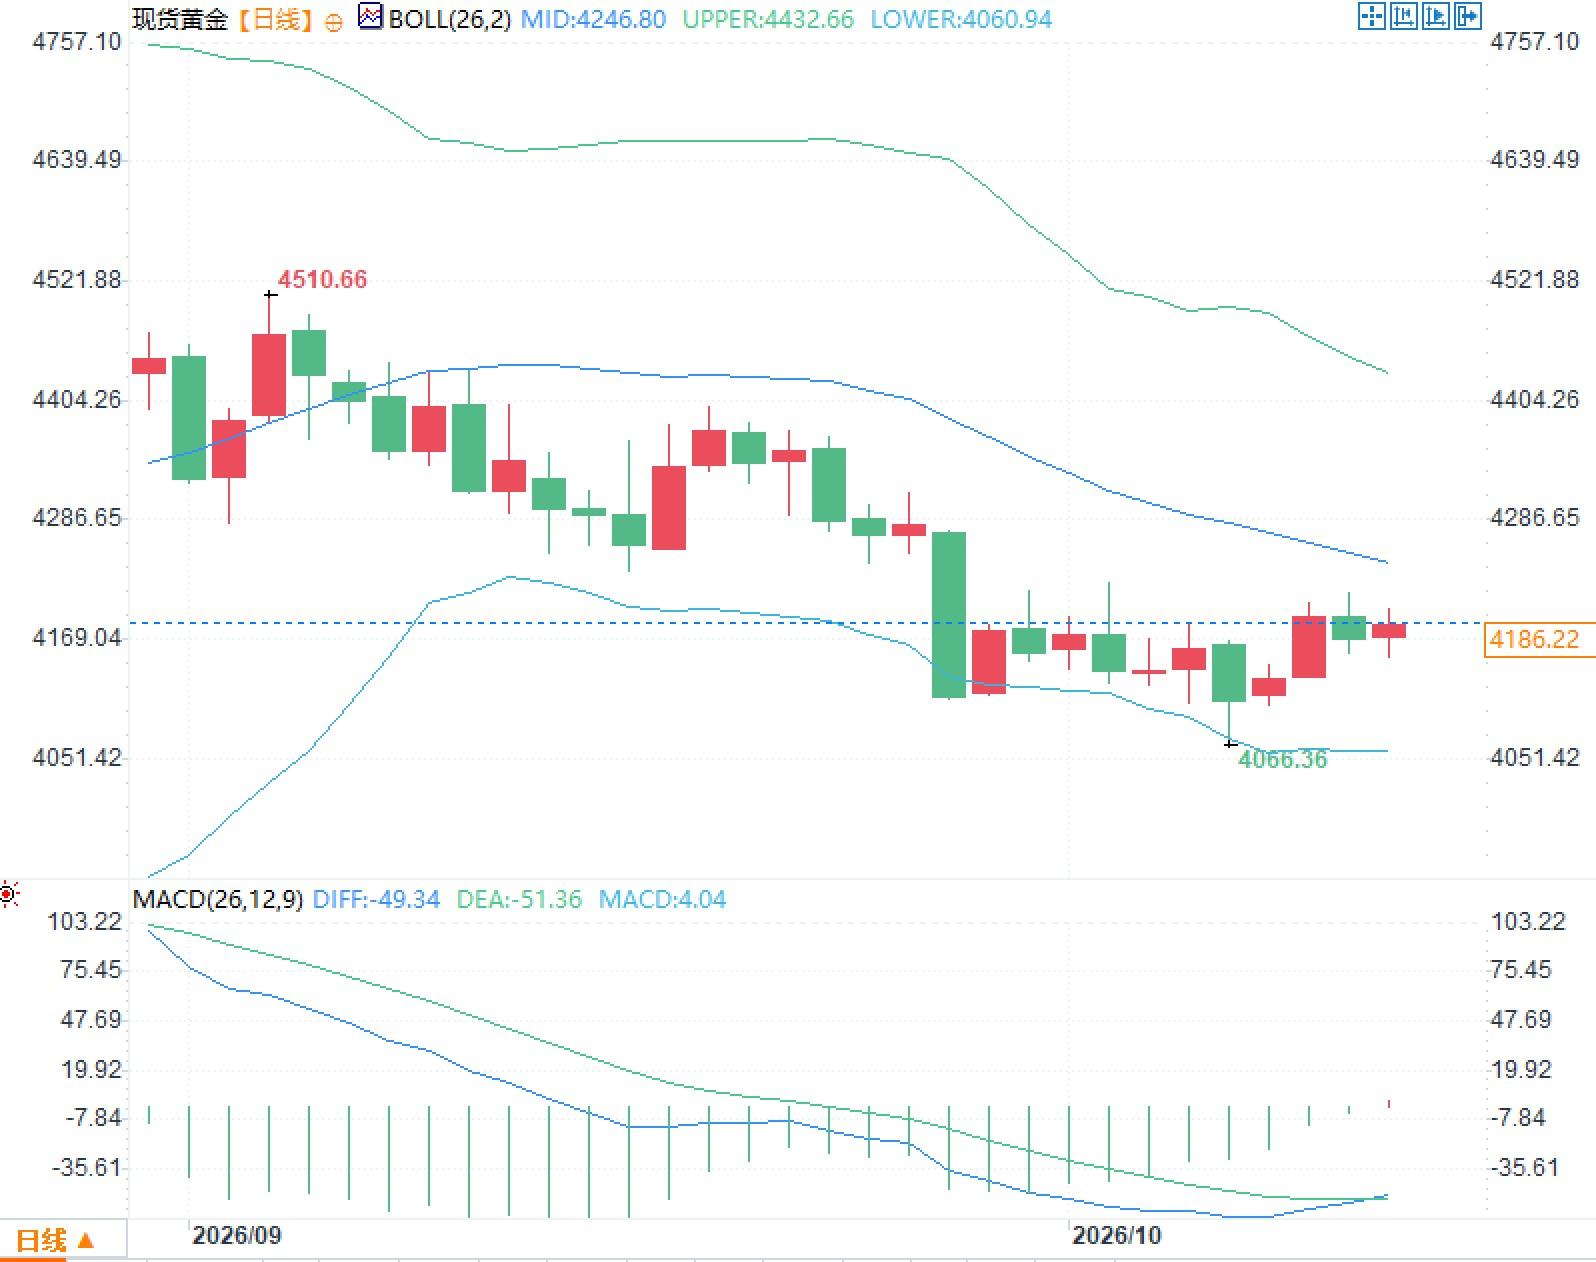
The daily chart shows the Bollinger Bands' middle band around 4246.80, the upper band at 4432.66, and the lower band at 4060.94, with the price trading between the middle and lower bands. The MACD fast and slow lines remain below the zero line, but the histogram has turned positive. These indicators suggest that volatility is in a relatively contracting phase, with bullish and bearish forces temporarily balanced, and no clear trend confirmation signal yet formed. The price entered a consolidation phase after falling from the previous high of 4510.66, with a low reaching around 4066.36. The technical picture shows range-bound trading, echoing the divergence in capital flows and macroeconomic uncertainties in the fundamentals, indicating an increased reliance on data verification by the market.Frequently Asked Questions
Question 1: What does the significant inflow into ETFs during the gold price correction indicate? Answer: It indicates that long-term allocation funds did not leave the market despite short-term price declines. Some investors are focusing on structural factors such as debt costs and actual purchasing power, rather than simply responding to expectations from a single policy meeting. Question 2: How to understand the coexistence of futures long position reductions and ETF holding increases? Answer: The two types of market participants have different time preferences. Leveraged futures trading is more sensitive to short-term fluctuations, while physical ETFs reflect strategic allocation needs more. This divergence itself constitutes an important characteristic of the price formation mechanism. Question 3: What is the impact path of this week's US inflation data on the pricing logic of precious metals? Answer: The data results will affect the market's assessment of the Fed's further tightening path, which in turn affects the relative attractiveness of precious metals through real yields and the dollar's performance. Meanwhile, fluctuations in oil prices provide additional disturbances.- Risk Warning and Disclaimer
- The market involves risk, and trading may not be suitable for all investors. This article is for reference only and does not constitute personal investment advice, nor does it take into account certain users’ specific investment objectives, financial situation, or other needs. Any investment decisions made based on this information are at your own risk.