US crude oil at the $96 mark: Analysis of the combined effects of the negotiation stalemate and declining inventories.
2026-10-16 19:20:19
On Friday, October 16th, US crude oil prices fell by about 0.6% during the day, currently trading around $96 per barrel, after reaching a recent high of around $98.32 per barrel in the previous trading session. Market focus was on declining traffic in the Strait of Hormuz and slow progress in related negotiations. The US insists that Iran must prioritize conditions related to its nuclear program, while Iran emphasizes lifting the maritime blockade as a priority. These differences in position have led to a continued standstill in negotiations, resulting in frequent incidents of ships being attacked and sinking due to mines in the strait. Meanwhile, the conflict between Saudi Arabia and the Houthis continues, with airports and energy facilities becoming targets, to which Saudi Arabia has responded. Unexpectedly low US inventory data further impacted market assessments of the supply side. 
Supply constraints and negotiation process in the Strait of Hormuz
The Strait of Hormuz normally handles about one-fifth of global oil shipments, with a daily throughput of 17 to 20 million barrels. Current throughput is significantly below this baseline, with some tracking data showing a recent drop in daily crude oil and product outflows to around 9 million barrels, roughly half the normal level. The Iranian navy and related forces have expanded their surveillance deployments east of the strait and in the Gulf of Oman. Official statements emphasize that the waterway falls within the scope of national security guarantees, and any uncoordinated passage will face corresponding measures. Iran has clearly stated that it will continue to implement relevant control arrangements while the US maintains its blockade and sanctions, and commercial vessels must pass according to established rules. The US, on the other hand, has placed its nuclear program as a precondition for negotiations, and the differences in priorities between the two sides have resulted in limited substantive progress. Trump recently stated publicly that he would not take military action against Iran before the November 3rd midterm elections, while emphasizing that the maritime blockade would remain in place. This statement has limited the expectation of escalation to some extent, but actual passage through the strait remains constrained by multiple factors. Persistent uncertainty on the supply side makes it difficult for risk premiums to dissipate quickly, and the market remains sensitive to any negotiation signals.Impact of the Saudi-Houthi conflict on regional energy infrastructure
The conflict between Saudi Arabia and the Houthis has recently escalated again, with the Houthis launching attacks on Saudi airports and Aramco-related facilities, and Saudi Arabia responding with actions in Houthi-controlled areas. Airport closures and damage to energy facilities directly impact regional logistics and some refining capacity, while also disrupting investor participation in related activities. The Saudi Energy Minister stated that supply continuity will be ensured through maintenance, repairs, rerouting, and alternative routes. Alternative routes such as the East-West pipeline previously served as some diversionary measures, but the current concurrence of the Strait of Hormuz and Houthi activities puts pressure on both east and west export routes. The ongoing regional conflict has made the market more cautious in assessing the resilience of Gulf supply, and any further events targeting key facilities could amplify price volatility. Compared to the negotiation process, this conflict dimension reflects more the risk of localized supply disruptions than the expectation of a complete disruption.Changes in US Commercial Inventories and Supply-Demand Balance
Data from the U.S. Energy Information Administration showed that U.S. commercial crude oil inventories fell by 8.6 million barrels to 415.6 million barrels in the week ending October 9, about 3% below the five-year average. Refinery utilization remained around 93.5%, with crude oil production estimated at 13.7 million barrels per day, a slight decrease from the previous week, partly due to the impact of the hurricane. Gasoline inventories rose, while distillate fuel inventories fell, resulting in an overall decrease in commercial petroleum inventories. Inventories at Cushing, Oklahoma, saw a slight increase. This decline exceeded most market expectations, indicating that the domestic supply buffer has narrowed against the backdrop of declining imports and relatively stable refinery operations. While inventory declines themselves do not directly determine price direction, their combination with Strait of Hormuz constraints has strengthened market focus on global supply elasticity. If subsequent weekly data continue to show inventory depletion or further import restrictions, the market's pricing logic for the existing risk premium may persist.Technical Indicators
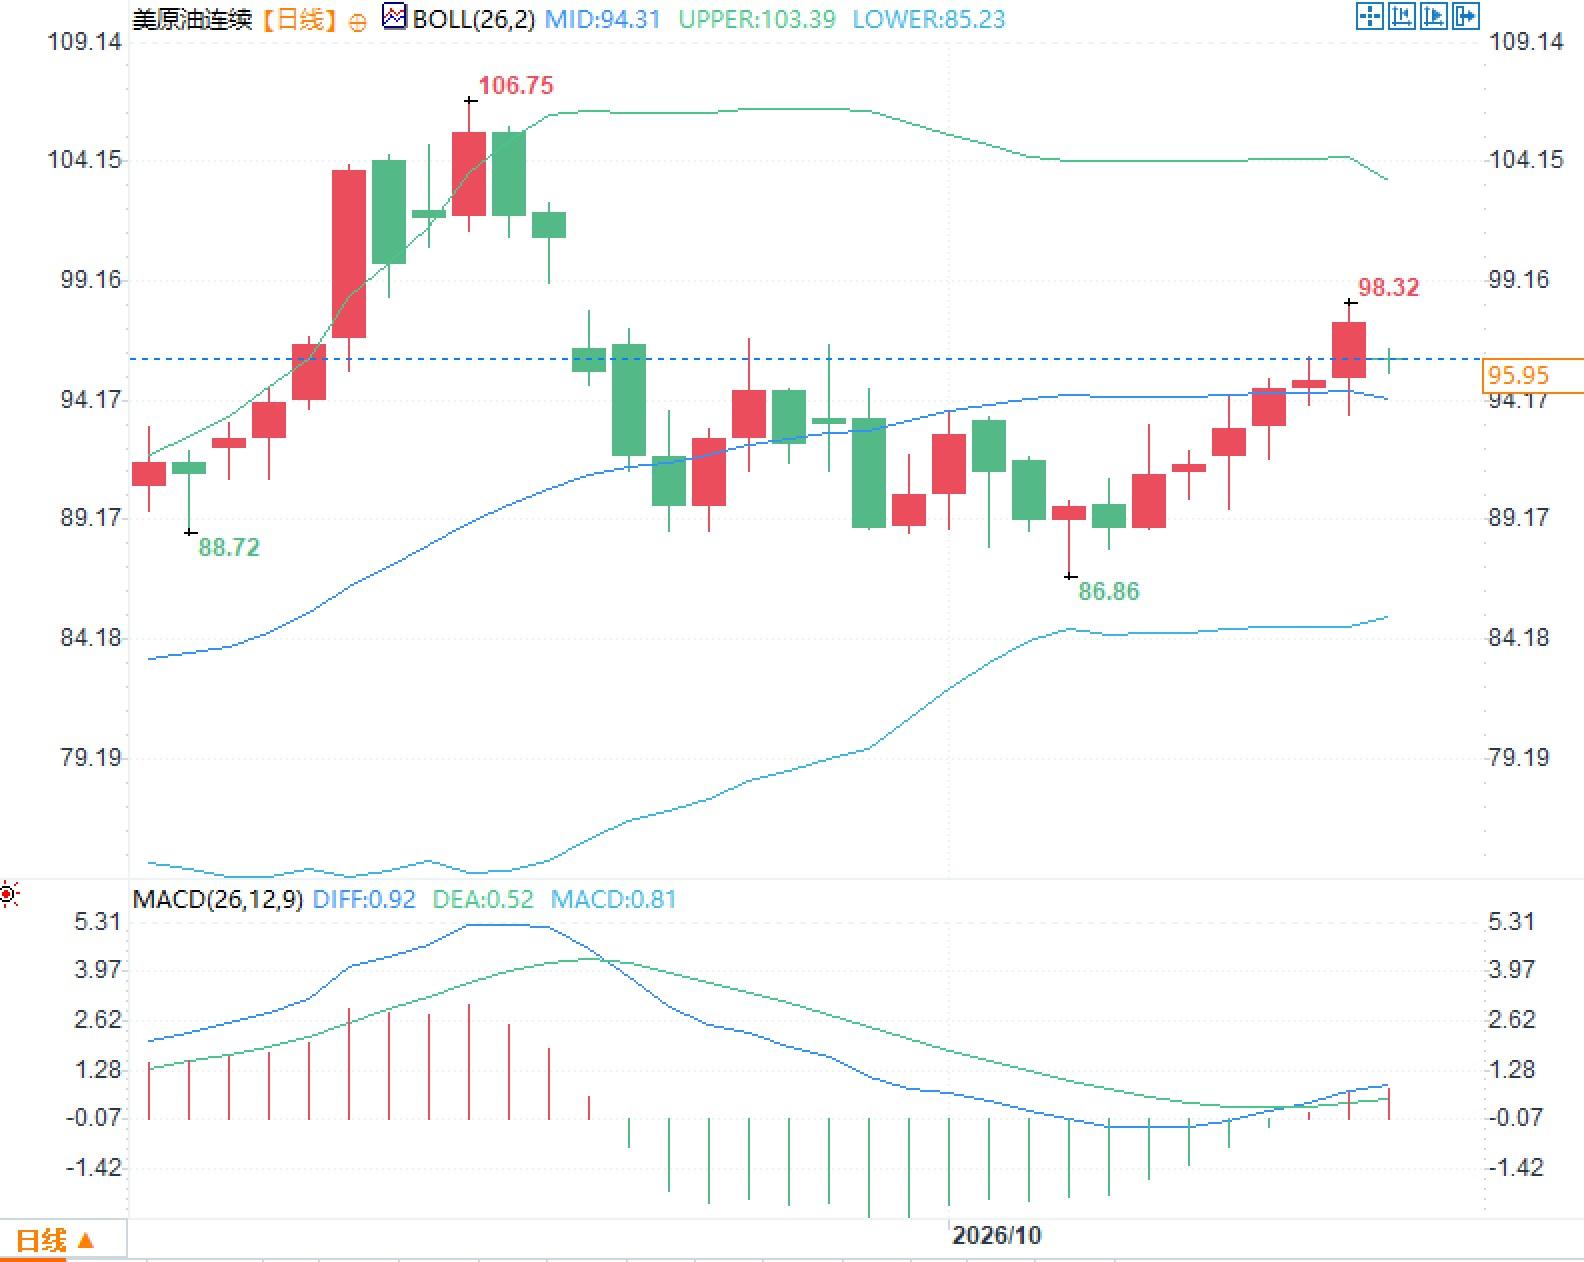
The daily chart for US crude oil shows the Bollinger Bands with the middle band at $94.31 per barrel, the upper band at $103.39 per barrel, and the lower band at $85.23 per barrel. The current price is trading near the middle band, having recently reached a high of $106.75 per barrel before pulling back and fluctuating around the middle band. The MACD indicator shows the DIFF at 0.92, the DEA at 0.52, and the MACD histogram at 0.81, all above the zero line. After the price pullback from the previous high, the volatility has narrowed, but it has not yet completely broken out of the trading range near the middle band.
- Risk Warning and Disclaimer
- The market involves risk, and trading may not be suitable for all investors. This article is for reference only and does not constitute personal investment advice, nor does it take into account certain users’ specific investment objectives, financial situation, or other needs. Any investment decisions made based on this information are at your own risk.