Following Warsh's remarks, market pricing shifted; how should the dollar index's performance be interpreted?
2026-10-21 19:02:30
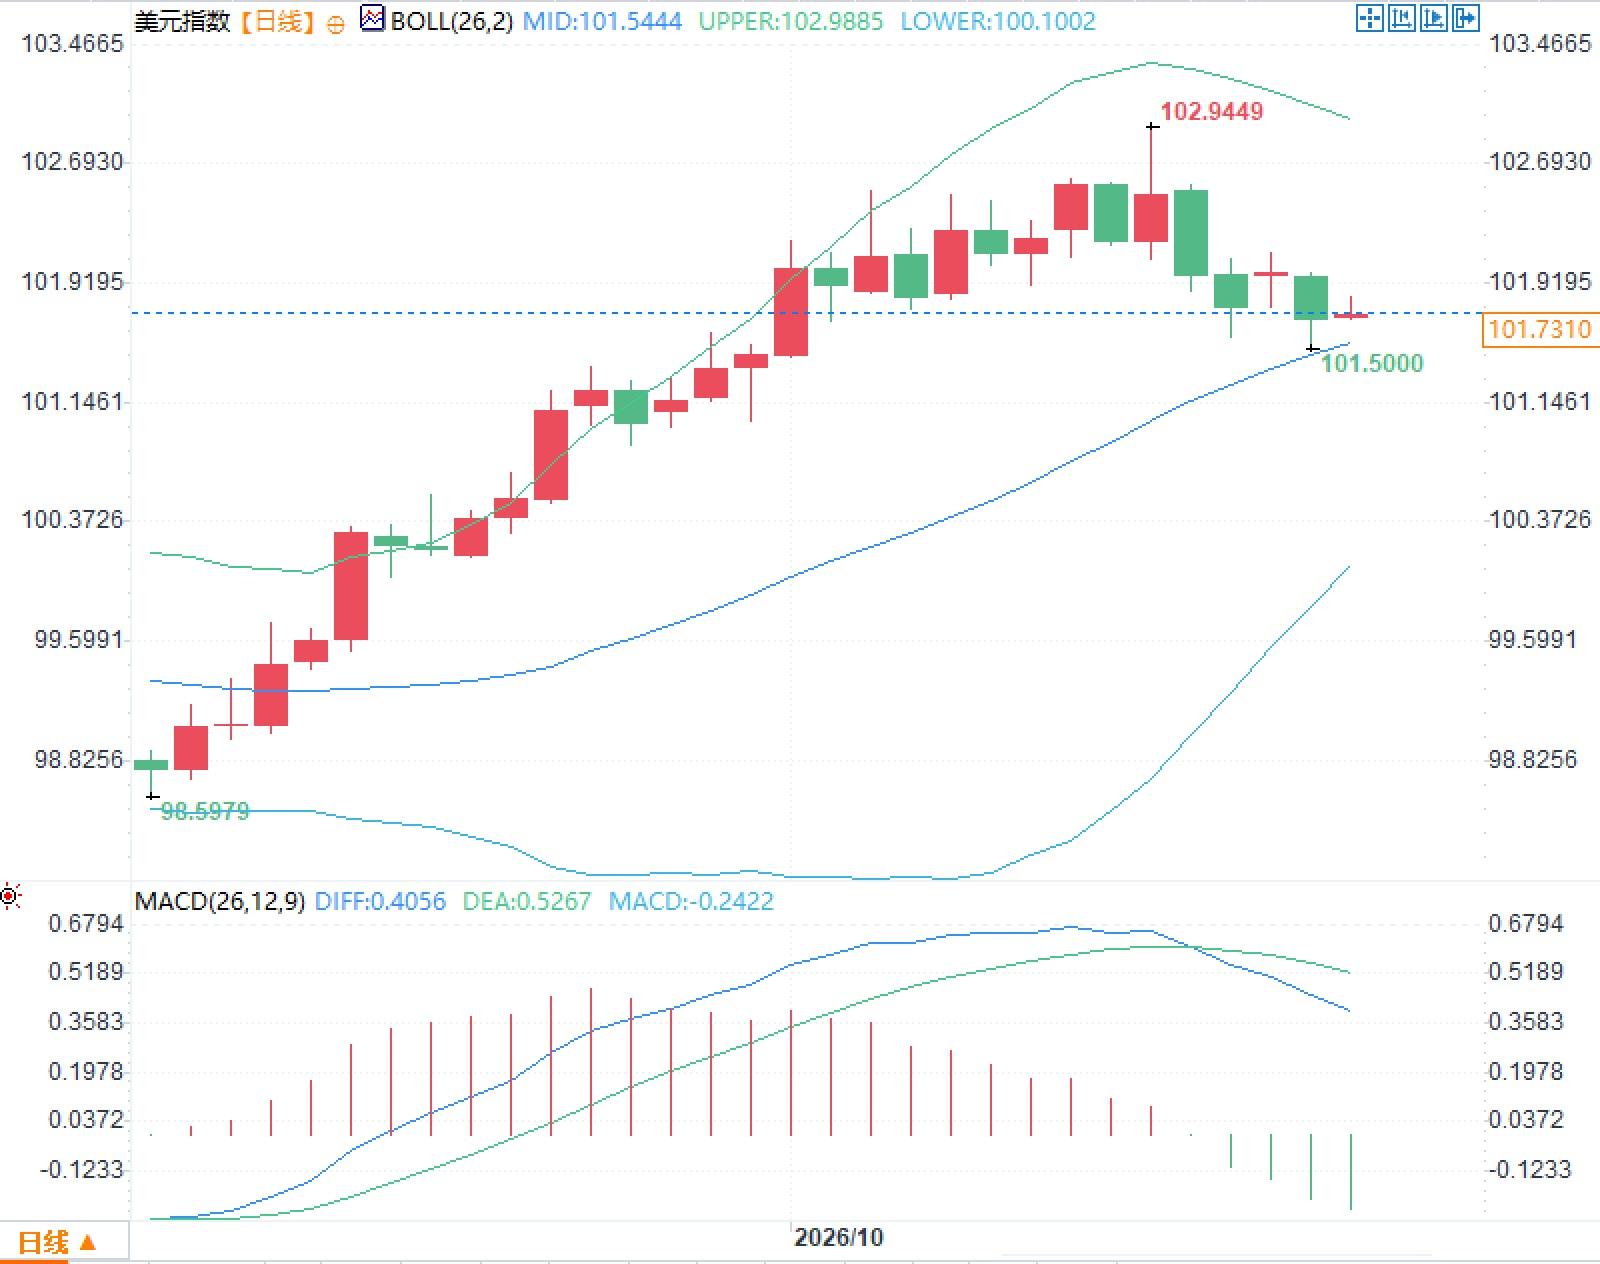
On Wednesday, October 21, the US dollar index was fluctuating around 101.70, a significant drop from its high of 102.94 on October 14. Previously, the US September Consumer Price Index (CPI) rose 0.6% month-on-month and 3.7% year-on-year, with the core CPI rising 0.3% month-on-month and 2.6% year-on-year, both exceeding market expectations. The Producer Price Index (PPI) rose 1.3% month-on-month and 6.3% year-on-year, reaching recent highs. The federal funds rate remained in the 3.75% to 4% range. The Federal Reserve will hold a policy meeting on October 27-28. The market's probability of another rate hike that month has fallen to about 15% to 30%, while expectations for a December rate hike still dominate. The yield on the 10-year US Treasury bond was around 5.11%, indicating that financial conditions are tightening through the bond market. 
US inflation data redefines policy path
The U.S. Consumer Price Index (CPI) rose 3.7% year-over-year in September from 3.4% in August, while the core CPI rose 2.6% from 2.4%. Energy prices rose 20.4% year-over-year, with gasoline prices increasing 34.2% year-over-year and 9.1% month-over-month, contributing more than half of the monthly increase. Service prices remained at 3.2% year-over-year, as did housing prices, indicating that pressure was not limited to energy or tariff-related goods. The strong producer price index reading further suggests an increased likelihood of wholesale costs being passed on to consumers. The Federal Reserve is paying closer attention to the personal consumption expenditures (PCE) price index, which will be released on October 29th; wholesale price trends suggest it may be higher than previously expected. Market indicators of long-term inflation expectations have risen somewhat, but remain significantly below the official target of 2%. Policy rates have currently failed to adequately constrain demand, putting the process of inflation returning to the target under pressure. Chairman Kevin Warsh recently stated that the global economy has shown resilience in the face of energy shocks, but price stability remains a core priority, and emphasized that he would not prejudge the meeting's outcome.Energy prices are being passed on to a wider range of sectors.
The Middle East conflict has driven up energy costs, spreading from the transportation sector to a wider range of areas. Wholesaler profit margins, previously squeezed by tariffs and fuel prices, are now recovering by raising end-user prices. The 3.2% year-on-year increase in US service inflation indicates that the problem is not limited to industries directly affected by energy or tariffs. The resilience of housing and leisure-related prices, coupled with short-term demand shocks from AI-related investments, has broadened price pressures. The reduced breadth of price increases in September provides a favorable signal for observing the persistence of inflation. However, single-month data should not be over-interpreted; more evidence is needed to determine whether the energy and tariff shocks will subside in the coming months. Rising US Treasury yields have already tightened financial conditions to some extent, and even if policy rates remain unchanged, they can still exert some restraint on demand.Pre-Fed Meeting Expectations
Ahead of the October 27-28 meeting, market pricing in an interest rate hike had cooled significantly. During the Bangkok meeting, Warsh explicitly stated that he would not prejudge the meeting's outcome and reiterated his commitment to price stability. Most officials recently hinted that more data needed to be observed before deciding on the timing of further tightening, which largely aligns with the market's pricing in a hold in October and further action in December. If subsequent data fails to change the assessment that inflation is above target, the need for further policy rate increases may increase. Currently, the US Treasury market has already provided some tightening, with the 10-year yield remaining above 5%, constraining demand. Warsh focuses on the breadth of price increases as a measure of inflation persistence; this indicator declined in September, providing a buffer for decision-making.Current Technical Structure of the US Dollar Index
The US Dollar Index daily chart shows the price hovering around 101.70, with the Bollinger Band middle line at 101.54, the upper band at 102.99, and the lower band at 100.10. The index recently retreated from its high of 102.94 and is currently near the middle band area. In the MACD indicator, the DIFF line is at 0.41, the DEA line at 0.53, and the histogram is negative at 0.24, indicating a weakening of short-term momentum. The price is consolidating near the middle band and has not formed a sustained breakaway pattern from the moving average. Volatility is within the normal range, and indicators have not shown extreme deviations. The current technical structure reflects a correction after the recent high, and future price movements will depend on further confirmation from fundamental data and policy signals.Frequently Asked Questions
Question 1: Why did the US September inflation data reignite policy discussions? Answer: The US Consumer Price Index (CPI) rose 3.7% year-on-year, core CPI 2.6%, and Producer Price Index (PPI) 6.3% year-on-year, all indicating that price pressures have not subsided. Furthermore, energy costs have been passed on to broader sectors such as services, prompting a reassessment of the current constraints on policy interest rates. Question 2: Why did the market lower the probability of a Fed rate hike in October? Answer: Warsh explicitly stated that he would not prejudge the meeting, and most officials preferred to wait for more data. Coupled with the fact that rising US Treasury yields have already provided some tightening, the market has shifted its focus on a rate hike to December.- Risk Warning and Disclaimer
- The market involves risk, and trading may not be suitable for all investors. This article is for reference only and does not constitute personal investment advice, nor does it take into account certain users’ specific investment objectives, financial situation, or other needs. Any investment decisions made based on this information are at your own risk.