EUR/USD Analysis: Attempting a Reversal, Struggling to Break Through
2026-10-23 01:48:21
Concerns continue to escalate in the French bond market, and volatility in related markets has yet to subside. As a result, the euro has experienced a sharp sell-off since early September; more than six weeks later, there are still no clear signs of a recovery.  Following the release of the US Consumer Price Index (CPI), the market faced the possibility of a complete sell-off last week. The higher-than-expected CPI data gave dollar bulls (and thus EUR/USD bears) ample reason to continue exerting pressure, which was indeed the case initially. However, this momentum did not last long, as the market rebounded later in the same trading day, leading to a bullish engulfing candlestick pattern on Thursday. More noteworthy than the technical pattern itself is the market environment in which it occurred: even the subsequent release of a stronger-than-expected US Producer Price Index (PPI) failed to prevent this reversal. This bullish engulfing candlestick propelled the market higher on Friday, resulting in the first weekly gain in six weeks. This upward trend continued at the start of this week, but subsequently encountered resistance, with bulls failing to push the exchange rate to test the 1.1275-1.1285 resistance zone.
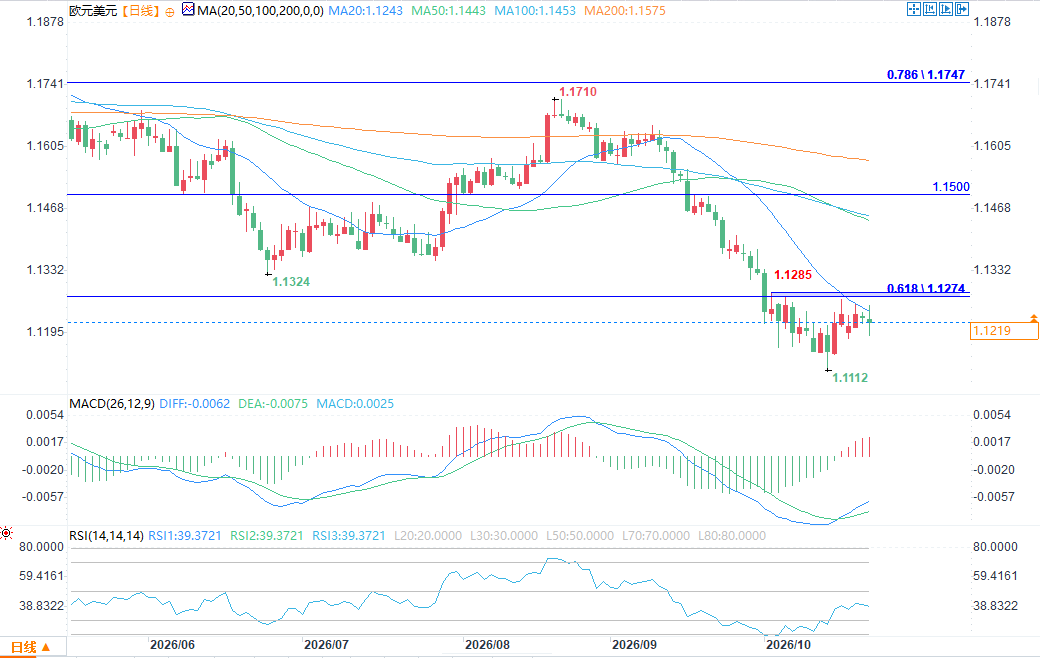 (EUR/USD daily chart source: EasyForex) 1.1200 key level
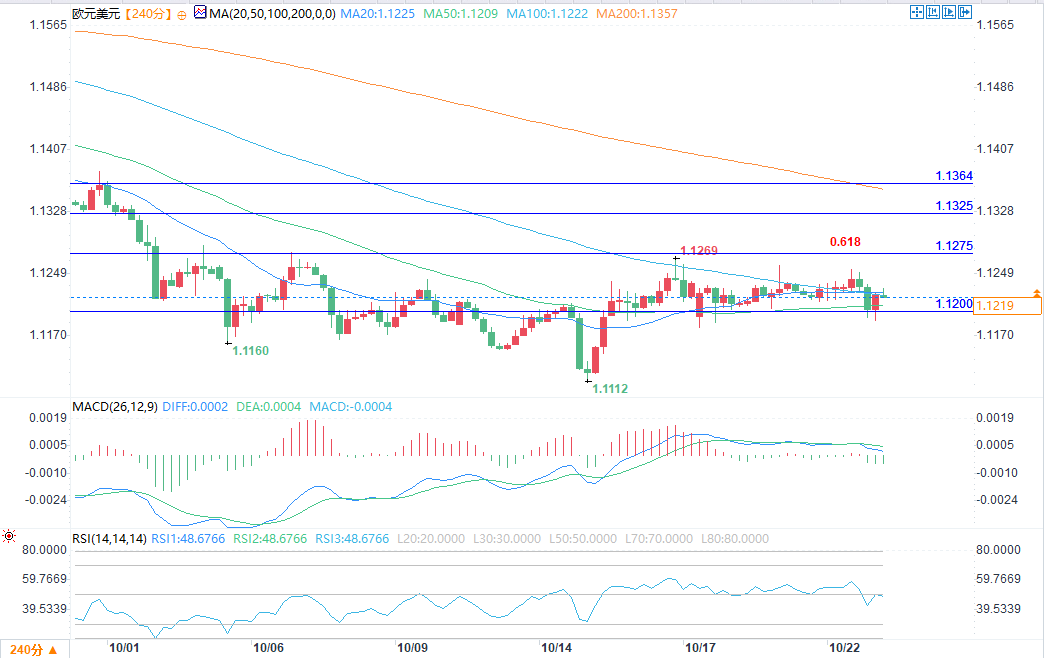 (EUR/USD 4-hour chart source: EasyForex) Although buyers haven't fully taken control of the market, bears have been on the defensive since last week's reversal. The 4-hour chart shows the price forming a higher low at the familiar 1.1200 level. This level was held multiple times last Thursday, Sunday, and Monday, indicating sustained support above last week's low. Simultaneously, a reverse head and shoulders bottom pattern has formed on the 4-hour chart, with the neckline falling precisely in the 1.1275-1.1285 range. This further increases the likelihood of an upward breakout; a successful break above this neckline would signal a larger-scale market reversal or the start of a bullish trend. However, the market hasn't reached that point yet; what we're currently seeing is a stalled bearish offensive. Nevertheless, if the bulls can complete the next upward breakout, the current situation will have the initial conditions for a market reversal. At 01:44 Beijing time, EUR/USD was trading at 1.1219/20, down 0.11%.
Following the release of the US Consumer Price Index (CPI), the market faced the possibility of a complete sell-off last week. The higher-than-expected CPI data gave dollar bulls (and thus EUR/USD bears) ample reason to continue exerting pressure, which was indeed the case initially. However, this momentum did not last long, as the market rebounded later in the same trading day, leading to a bullish engulfing candlestick pattern on Thursday. More noteworthy than the technical pattern itself is the market environment in which it occurred: even the subsequent release of a stronger-than-expected US Producer Price Index (PPI) failed to prevent this reversal. This bullish engulfing candlestick propelled the market higher on Friday, resulting in the first weekly gain in six weeks. This upward trend continued at the start of this week, but subsequently encountered resistance, with bulls failing to push the exchange rate to test the 1.1275-1.1285 resistance zone. (EUR/USD daily chart source: EasyForex) 1.1200 key level (EUR/USD 4-hour chart source: EasyForex) Although buyers haven't fully taken control of the market, bears have been on the defensive since last week's reversal. The 4-hour chart shows the price forming a higher low at the familiar 1.1200 level. This level was held multiple times last Thursday, Sunday, and Monday, indicating sustained support above last week's low. Simultaneously, a reverse head and shoulders bottom pattern has formed on the 4-hour chart, with the neckline falling precisely in the 1.1275-1.1285 range. This further increases the likelihood of an upward breakout; a successful break above this neckline would signal a larger-scale market reversal or the start of a bullish trend. However, the market hasn't reached that point yet; what we're currently seeing is a stalled bearish offensive. Nevertheless, if the bulls can complete the next upward breakout, the current situation will have the initial conditions for a market reversal. At 01:44 Beijing time, EUR/USD was trading at 1.1219/20, down 0.11%.
- Risk Warning and Disclaimer
- The market involves risk, and trading may not be suitable for all investors. This article is for reference only and does not constitute personal investment advice, nor does it take into account certain users’ specific investment objectives, financial situation, or other needs. Any investment decisions made based on this information are at your own risk.