Falling oil prices eased inflation concerns, causing gold to rebound slightly and fluctuate around the $4,000 mark.
2026-10-27 10:42:23
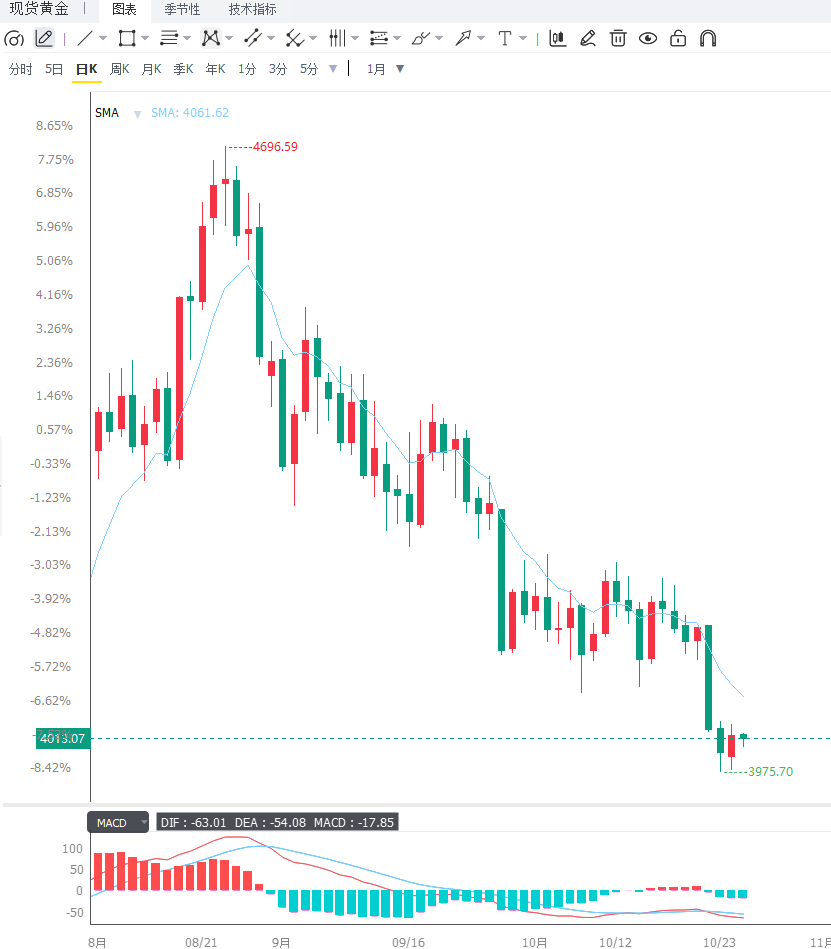
On Tuesday morning in Asia, spot gold traded around $4010, experiencing a technical rebound from its July lows. The core contradiction in gold prices lies in the fact that the decline in oil prices has removed the main driving force of the "inflation-deflation" headwind chain, giving gold some breathing room; however, the systematic short positions held by CTAs and the high probability of a year-end rate hike have created a mechanical resistance level above. This combination of "weakening fundamental headwinds and unchanged positioning structure" suggests that this rebound is more of a correction than a reversal, with the key test being whether the $4000 level can be held.  From a supporting perspective, oil prices are the most direct transmission channel. The Saudi Defense Minister's visit to Tehran for talks represents the highest-level contact in this round of Middle East diplomatic maneuvering, its significance lying in moving the "open door to negotiations" from a mere statement to an operational level. "Light trading, hovering around $4,000, waiting for the Fed to speak"—this means that the gold price rebound lacks incremental capital driving it, and is more of a combination of short covering and bargain hunting. The typical characteristics of this type of rebound are its speed and weak sustainability: it can repair technical indicators in the short term, but it is difficult to independently reconstruct the trend. For investors, this highlights an important discipline: breakouts formed in light market conditions naturally have reduced credibility and must wait for secondary confirmation after liquidity returns. However, the position structure information provided by TD Securities makes the technical implications of this rebound clearer. The bank points out that "the long-term bullish outlook for gold is facing a test near the $4,000/ounce level, with CTAs currently in a bearish state across all signals," and emphasizes that "CTAs are already heavy sellers of gold, with systematic funds shorting across all momentum indicators," leading to a downward-sloping portfolio structure. The duality of this reading is noteworthy: on the one hand, it explains why gold prices failed to smoothly decline after breaking below $4,000, limiting further downside potential; on the other hand, it also means that any upward breakout could trigger mechanical short covering. TD Securities explicitly provides a quantitative threshold: "CTAs will begin covering short positions above $4,092/ounce." This means that $4,092 is a key trigger level—once gold prices consistently hold above this level, algorithmic buying could create a self-reinforcing upward push. Before that, the $4,000 to $4,092 range is more like a "bear-dominated but potentially squeezed" zone, rather than a simple resistance level. The resilience of the fundamentals provides another layer of support. TD Securities points out that "spot and futures prices have fallen below the key $4,000/ounce level, but the market has once again demonstrated strong resilience, with prices rebounding in a fairly short period of time." The bank also notes that "although ETF inflows have slowed recently, the overall trend remains supportive, with central bank demand being a key upward driver, especially when prices are in this area." This assessment provides a relatively reliable logical foothold for the bulls: the current decline is mainly driven by leveraged funds and technical trading, rather than a collapse in physical demand. As long as central bank gold purchases and the trend of ETF inflows remain valid, every deep pullback below $4,000 is more likely to encounter support from physical buying. This is also the fundamental reason why gold prices were able to pull back from $3,995 to $4,010 within two days—support below comes from structural demand, while resistance above comes from cyclical positions; the different time scales of these two factors determine that the consolidation will be more prolonged than a one-sided trend. Policy expectations, on the other hand, set a ceiling from another perspective. Although Wednesday's rate hold was fully priced in (with only a 10% probability of a rate hike), the probability of at least one rate hike before the end of the year remains as high as 82.3%, meaning that year-end holding cost pressures have not been relieved. Fed Chairman Warsh's recent speeches scored 5.6/10, slightly below the historical average of 6.1/10, with a relatively dovish but still cautious tone. He acknowledged that he was "deeply wounded by the global financial crisis," emphasized structural growth and the surge in investment driven by "good policies," viewed artificial intelligence as a short-term demand-side force and a tool to boost data confidence, while refusing to predict the decisions in October and December, and emphasizing the spillover effects of US policy on the rest of the world. The FXS Fed Sentiment Index remained unchanged at a high of 127.51, indicating that the overall policy narrative remains firmly in the hawkish range. For gold, this is an environment of "no short-term catalysts and medium-term headwinds": the meeting itself is unlikely to provide incremental positive factors, but Warsh's repeated emphasis on persistently high inflationary pressures makes any rebound likely to encounter selling pressure at relatively high levels. What truly changes this landscape is not the outcome of a single meeting, but whether there is a substantial easing of the central level of real interest rates. From a cross-asset perspective, the current volatility in gold is essentially a confluence of four factors: first, the proactive pressure exerted by falling oil prices through inflation and interest rate channels; second, the mechanical suppression and potential cover-up triggered by widespread short positions in CTAs; third, the structural support provided by central bank demand and the trend of ETF inflows; and fourth, the valuation ceiling created by the fact that the Fed's year-end path has not been disproven. It is worth noting that the same round of Middle East diplomatic developments simultaneously impacted both crude oil and gold: it lowered oil prices but also weakened safe-haven demand. After offsetting these factors, the net direction of gold depends more on real interest rates than on geopolitical narratives—which explains why gold has consistently lagged behind crude oil in this round of tensions. It is inappropriate to view the daily fluctuations in gold prices in isolation, but rather to assess them within the transmission chain of "oil prices—inflation—real interest rates—exchange rates": only when the interest rate side of this chain easing can the credibility of a temporary bottom for gold be established. On the daily chart, spot gold has rebounded from its lows to around $4010, with the price regaining its position above the lower Bollinger Band. The short-term bias has shifted from bearish to neutral-bullish, but the overall trend remains consolidating. The RSI is at 35.20, recovering from oversold territory, indicating that selling pressure is weakening rather than a trend reversal – a typical "oversold correction, awaiting confirmation" pattern. Support levels are first seen at the lower Bollinger Band around $4020, followed by the psychological level of $4000 and the previous support level of $3980. $4000 is a key psychological level; if the daily close holds above this level, the bullish structure will be maintained. The next resistance levels to watch are $4020, $4092 (CTA short covering trigger point), around $4130 (20-day Bollinger Band middle line), and around $4220 (100-day simple moving average). Currently, the indicator set does not show any near-term resistance levels, meaning that once $4020 is effectively broken and held, the technical indicators above are relatively sparse, and buyers may attempt to push towards $4092. Only a sustained hold above $4092 could trigger a systemic short covering and open up space for an upward move towards $4130. On the 4-hour chart, gold prices rebounded from around $3995 and then slowly moved upwards along the short-term moving average. The MACD histogram has converged from below the zero line, and the fast and slow lines are becoming intertwined, indicating a shift from bearish to neutral momentum. Currently, the price is fluctuating narrowly between $4005 and $4015. If it retraces to $4000-$4005 and finds support, there is still a chance for a short-term upward move towards $4015-$4025. However, if it breaks below $3995 with significant volume, it may seek support at $3980 or even $3950.
 Editor's Summary: The core contradiction for gold in the short term lies in the easing of inflation and tightening headwinds caused by falling oil prices, the potential for short covering by CTA short positions, and the high probability of a Fed rate hike at the end of the year coupled with thin market conditions limiting the smoothness of any rebound. These two factors suggest that gold prices are more likely to consolidate within the $4000-$4020 range, awaiting a breakthrough at the Fed meeting. Three key variables to watch going forward are: first, the Fed's decision, policy statement, and Warsh press conference on Wednesday, whose statements on inflationary pressures will directly determine the year-end holding costs; second, the price movements of Brent and WTI crude oil and the progress of Middle East diplomatic negotiations, which are prerequisites for inflation expectations and real interest rates; and third, changes in CTA positions and the hold on the $4092 trigger level, as well as the continuity of central bank gold purchases and ETF fund flows, which are crucial for determining the sustainability of support below $4000.
From a supporting perspective, oil prices are the most direct transmission channel. The Saudi Defense Minister's visit to Tehran for talks represents the highest-level contact in this round of Middle East diplomatic maneuvering, its significance lying in moving the "open door to negotiations" from a mere statement to an operational level. "Light trading, hovering around $4,000, waiting for the Fed to speak"—this means that the gold price rebound lacks incremental capital driving it, and is more of a combination of short covering and bargain hunting. The typical characteristics of this type of rebound are its speed and weak sustainability: it can repair technical indicators in the short term, but it is difficult to independently reconstruct the trend. For investors, this highlights an important discipline: breakouts formed in light market conditions naturally have reduced credibility and must wait for secondary confirmation after liquidity returns. However, the position structure information provided by TD Securities makes the technical implications of this rebound clearer. The bank points out that "the long-term bullish outlook for gold is facing a test near the $4,000/ounce level, with CTAs currently in a bearish state across all signals," and emphasizes that "CTAs are already heavy sellers of gold, with systematic funds shorting across all momentum indicators," leading to a downward-sloping portfolio structure. The duality of this reading is noteworthy: on the one hand, it explains why gold prices failed to smoothly decline after breaking below $4,000, limiting further downside potential; on the other hand, it also means that any upward breakout could trigger mechanical short covering. TD Securities explicitly provides a quantitative threshold: "CTAs will begin covering short positions above $4,092/ounce." This means that $4,092 is a key trigger level—once gold prices consistently hold above this level, algorithmic buying could create a self-reinforcing upward push. Before that, the $4,000 to $4,092 range is more like a "bear-dominated but potentially squeezed" zone, rather than a simple resistance level. The resilience of the fundamentals provides another layer of support. TD Securities points out that "spot and futures prices have fallen below the key $4,000/ounce level, but the market has once again demonstrated strong resilience, with prices rebounding in a fairly short period of time." The bank also notes that "although ETF inflows have slowed recently, the overall trend remains supportive, with central bank demand being a key upward driver, especially when prices are in this area." This assessment provides a relatively reliable logical foothold for the bulls: the current decline is mainly driven by leveraged funds and technical trading, rather than a collapse in physical demand. As long as central bank gold purchases and the trend of ETF inflows remain valid, every deep pullback below $4,000 is more likely to encounter support from physical buying. This is also the fundamental reason why gold prices were able to pull back from $3,995 to $4,010 within two days—support below comes from structural demand, while resistance above comes from cyclical positions; the different time scales of these two factors determine that the consolidation will be more prolonged than a one-sided trend. Policy expectations, on the other hand, set a ceiling from another perspective. Although Wednesday's rate hold was fully priced in (with only a 10% probability of a rate hike), the probability of at least one rate hike before the end of the year remains as high as 82.3%, meaning that year-end holding cost pressures have not been relieved. Fed Chairman Warsh's recent speeches scored 5.6/10, slightly below the historical average of 6.1/10, with a relatively dovish but still cautious tone. He acknowledged that he was "deeply wounded by the global financial crisis," emphasized structural growth and the surge in investment driven by "good policies," viewed artificial intelligence as a short-term demand-side force and a tool to boost data confidence, while refusing to predict the decisions in October and December, and emphasizing the spillover effects of US policy on the rest of the world. The FXS Fed Sentiment Index remained unchanged at a high of 127.51, indicating that the overall policy narrative remains firmly in the hawkish range. For gold, this is an environment of "no short-term catalysts and medium-term headwinds": the meeting itself is unlikely to provide incremental positive factors, but Warsh's repeated emphasis on persistently high inflationary pressures makes any rebound likely to encounter selling pressure at relatively high levels. What truly changes this landscape is not the outcome of a single meeting, but whether there is a substantial easing of the central level of real interest rates. From a cross-asset perspective, the current volatility in gold is essentially a confluence of four factors: first, the proactive pressure exerted by falling oil prices through inflation and interest rate channels; second, the mechanical suppression and potential cover-up triggered by widespread short positions in CTAs; third, the structural support provided by central bank demand and the trend of ETF inflows; and fourth, the valuation ceiling created by the fact that the Fed's year-end path has not been disproven. It is worth noting that the same round of Middle East diplomatic developments simultaneously impacted both crude oil and gold: it lowered oil prices but also weakened safe-haven demand. After offsetting these factors, the net direction of gold depends more on real interest rates than on geopolitical narratives—which explains why gold has consistently lagged behind crude oil in this round of tensions. It is inappropriate to view the daily fluctuations in gold prices in isolation, but rather to assess them within the transmission chain of "oil prices—inflation—real interest rates—exchange rates": only when the interest rate side of this chain easing can the credibility of a temporary bottom for gold be established. On the daily chart, spot gold has rebounded from its lows to around $4010, with the price regaining its position above the lower Bollinger Band. The short-term bias has shifted from bearish to neutral-bullish, but the overall trend remains consolidating. The RSI is at 35.20, recovering from oversold territory, indicating that selling pressure is weakening rather than a trend reversal – a typical "oversold correction, awaiting confirmation" pattern. Support levels are first seen at the lower Bollinger Band around $4020, followed by the psychological level of $4000 and the previous support level of $3980. $4000 is a key psychological level; if the daily close holds above this level, the bullish structure will be maintained. The next resistance levels to watch are $4020, $4092 (CTA short covering trigger point), around $4130 (20-day Bollinger Band middle line), and around $4220 (100-day simple moving average). Currently, the indicator set does not show any near-term resistance levels, meaning that once $4020 is effectively broken and held, the technical indicators above are relatively sparse, and buyers may attempt to push towards $4092. Only a sustained hold above $4092 could trigger a systemic short covering and open up space for an upward move towards $4130. On the 4-hour chart, gold prices rebounded from around $3995 and then slowly moved upwards along the short-term moving average. The MACD histogram has converged from below the zero line, and the fast and slow lines are becoming intertwined, indicating a shift from bearish to neutral momentum. Currently, the price is fluctuating narrowly between $4005 and $4015. If it retraces to $4000-$4005 and finds support, there is still a chance for a short-term upward move towards $4015-$4025. However, if it breaks below $3995 with significant volume, it may seek support at $3980 or even $3950. Editor's Summary: The core contradiction for gold in the short term lies in the easing of inflation and tightening headwinds caused by falling oil prices, the potential for short covering by CTA short positions, and the high probability of a Fed rate hike at the end of the year coupled with thin market conditions limiting the smoothness of any rebound. These two factors suggest that gold prices are more likely to consolidate within the $4000-$4020 range, awaiting a breakthrough at the Fed meeting. Three key variables to watch going forward are: first, the Fed's decision, policy statement, and Warsh press conference on Wednesday, whose statements on inflationary pressures will directly determine the year-end holding costs; second, the price movements of Brent and WTI crude oil and the progress of Middle East diplomatic negotiations, which are prerequisites for inflation expectations and real interest rates; and third, changes in CTA positions and the hold on the $4092 trigger level, as well as the continuity of central bank gold purchases and ETF fund flows, which are crucial for determining the sustainability of support below $4000.
- Risk Warning and Disclaimer
- The market involves risk, and trading may not be suitable for all investors. This article is for reference only and does not constitute personal investment advice, nor does it take into account certain users’ specific investment objectives, financial situation, or other needs. Any investment decisions made based on this information are at your own risk.