Opinion: Will gold be driven down to 3500 first, and then pushed up to 7500 by policy?
2026-10-27 20:28:24
Some market observers believe that gold will be sold off along with risk assets during the actual deleveraging shock, and gold mining stocks may fall even more. This view uses $3,500 and $7,500 per ounce as extreme scenario references, emphasizing the second phase after the policy response. 
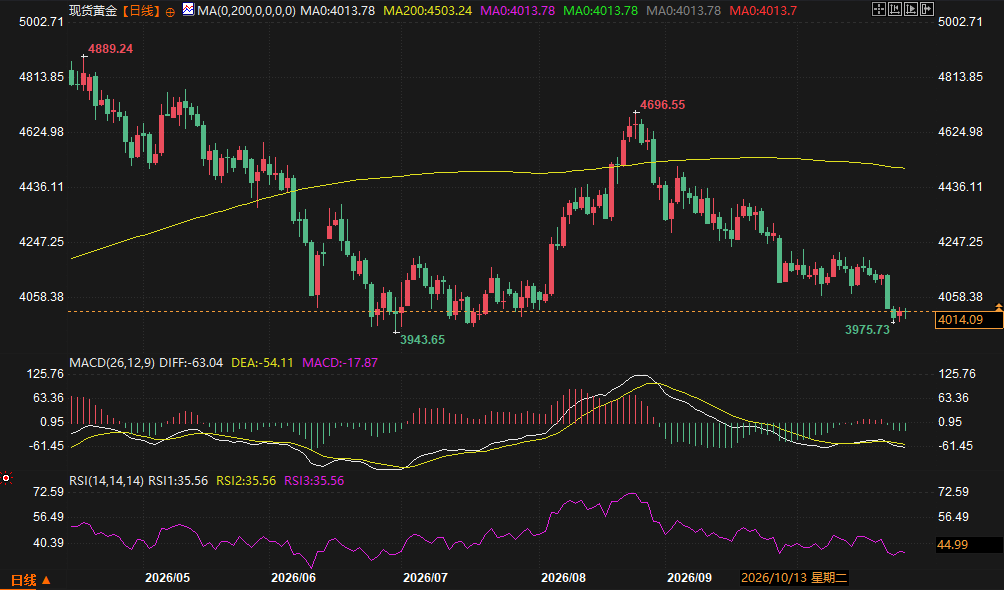
Market view: A decline followed by a rise, not a one-way bullish outlook.
Recent volatility in risk assets has increased, with technology stocks and speculative assets under pressure, and gold and gold mining stocks falling in tandem. Some overseas market commentators believe this is not a disproving of long-term bullish logic, but rather the first stage of a deleveraging liquidity shock . This view explicitly breaks down the path into two phases: an initial drop, followed by a rise; the initial drop is conditional, while the subsequent rise depends on policy response. When discussing extreme crash scenarios, this view mentions two price levels, $3,500 and $7,500 per ounce, as references for the two-stage deduction, not as investment advice.Phase 1: Sell what you can sell; gold mining stocks are more vulnerable.
This viewpoint argues that during true deleveraging, investors don't sell what they want to sell, but rather what they can sell; margin calls, deleveraging, and raising cash will lead to the indiscriminate selling of even high-quality assets. Gold is not immune; gold mining stocks, by their very nature, are leveraged stocks and are more easily sold than physical gold, potentially experiencing a larger percentage drop than gold itself. The viewpoint even discusses the possibility of gold mining stocks experiencing a 20%, 30%, or even deeper pullback during a broad market liquidation, while emphasizing that this does not mean the long-term fundamentals have disappeared.Phase Two: Policy Response is the Variable
This view argues that the initial sell-off is not the key issue; the key issue is what happens after the sell-off. The financial system's deep reliance on cheap credit and ample liquidity means that pressure from federal debt, deficits, and interest payments will make policymakers more inclined to intervene rather than continue tightening when faced with credit events, bond market disorder, deep stock market pullbacks, or liquidity crises. If the Federal Reserve responds with interest rate cuts, bond purchases, and liquidity tools, gold could rise rapidly from its deleveraging lows to $7,500/ounce or even higher; gold mining stocks, due to their operating leverage, have even greater upside potential, provided their balance sheets, production costs, and business fundamentals are sound. This view acknowledges that the bottom, the magnitude of the decline, and the timing of the reversal are unknown, and does not advocate blindly catching a falling knife.Technical Analysis: Weak fluctuations, medium-term resistance remains.
The daily chart shows that gold has retreated after peaking at high levels. The rebound failed to break through the previous high, and subsequently weakened again, currently consolidating weakly near the psychologically important psychological level and the previous low area. Prices are hovering around the 20-day moving average and remain well below the yearly moving average. Longer-term moving averages provided significant resistance during the previous rebound, indicating a bearish medium-term trend. The MACD is below the zero line, with the green bars narrowing, showing weakness but decreasing downward momentum; the RSI is neutral to weak, not yet oversold. There is no clear short-term direction, and market discussion focuses on whether the psychologically important psychological level and the previous low area can provide support. For any rebound, the area around and above the 20-day moving average should be observed. Technical analysis does not support equating a single day's decline directly with a change in long-term logic.QA
Q: Are 3500 and 7500 benchmark forecasts? A: No. This view uses them as references to extreme scenarios: 3500 corresponds to discussions of a decline during a period of sharp deleveraging, and 7500 corresponds to discussions of an upward trend after aggressive policy easing; this view explicitly states that the bottom and timing are unknown. Q: Why might gold mining stocks fall more sharply first? A: Gold mining stocks are leveraged stocks, with better liquidity than physical gold, making them easier to sell during deleveraging; however, operational leverage can also amplify upward potential during policy response phases, provided that the balance sheet and costs are sound. Q: What are the key conditions for a fall followed by a rise? A: The key is not the sell-off itself, but whether the sell-off triggers a sufficiently strong policy response. If the Fed maintains restrictive measures for longer, or if a crash damages the fundamentals of gold mining, the subsequent rise may be delayed or even not occur. Q: Which side does the current technical picture support? A: The daily chart still shows a weak consolidation after a pullback from a high level. The price is hovering around the 20-day moving average and is far below the yearly moving average. The MACD histogram is narrowing below the zero line, and the RSI is neutral to weak and not oversold. The short-term direction is unclear, and the medium-term resistance has not been eliminated.- Risk Warning and Disclaimer
- The market involves risk, and trading may not be suitable for all investors. This article is for reference only and does not constitute personal investment advice, nor does it take into account certain users’ specific investment objectives, financial situation, or other needs. Any investment decisions made based on this information are at your own risk.