Oil prices have been consolidating at recent high levels. What will happen next?
2026-10-27 20:38:24
Crude oil prices have been consolidating near recent highs as market concerns about an impending US strike on Iran have eased somewhat. However, escalating geopolitical tensions and stalled negotiations continue to support oil prices. Houthi attacks on Saudi Arabia's East-West oil pipeline and Riyadh airport have exacerbated market anxieties about potential supply disruptions.  Oil prices consolidated near recent highs as market concerns about an immediate US strike against Iran eased. However, the prolonged stalemate in negotiations and the persistent risk of escalation continued to support the market. Furthermore, talks between Saudi Arabia and Iran failed to yield substantial progress; no agreement was reached to stop Houthi attacks, nor did they ease tensions. Meanwhile, Houthi forces attacked a pumping station on the Saudi East-West oil pipeline and Riyadh airport yesterday. It's worth noting that the East-West pipeline is a key alternative oil export route; disruptions to the pipeline in September caused a significant surge in oil prices. Looking ahead: Middle East tensions and the possibility of another US strike will continue to support oil prices. Conversely, if the conflict between Saudi Arabia and the Houthis eases, or if the US-Iran negotiations unexpectedly achieve a major breakthrough, oil prices could experience a significant correction. Technical Analysis: The upward trend is hitting the ceiling of the long-term downtrend.
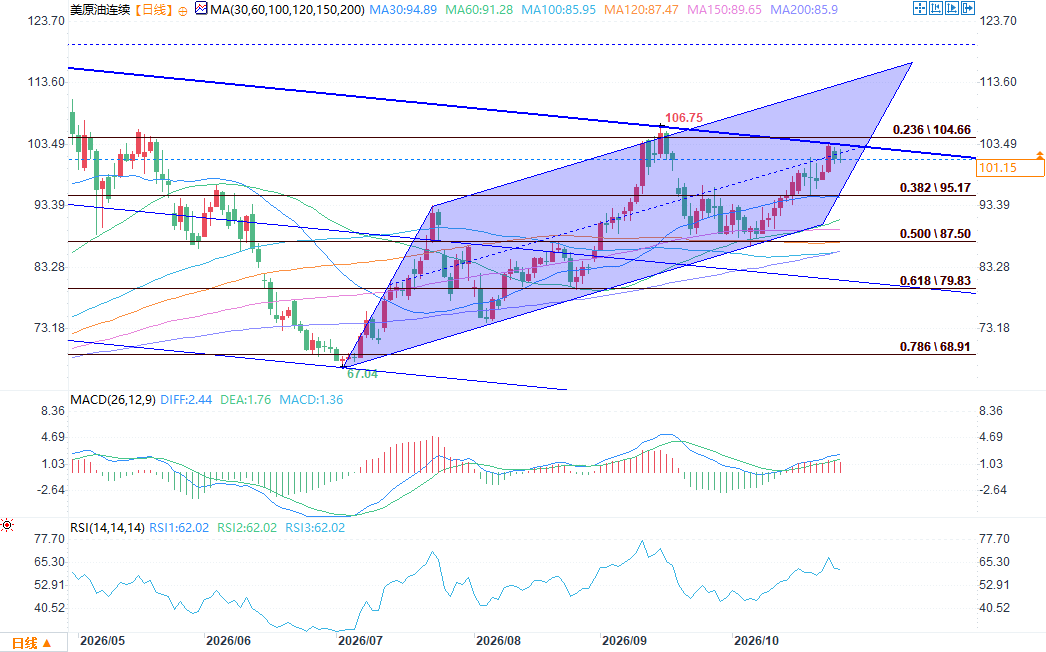 First, the overall trend is downward, and the current rise is merely a rebound. The blue downtrend line extending from the March high near 120 has been suppressing the upper edge of the long-term downtrend channel for the entire six months. This round of rise, which started at 67.04 at the end of June, is essentially a reverse rebound wave running below this downtrend line—no matter how good the rise looks, it is still a corrective wave within a larger downtrend, not a trend reversal. Now, the price has reached around 101, hitting the foot of this downtrend line (currently located at approximately 103-104), meaning that the entire rebound wave is undergoing the ultimate test of whether the "big trend" is accepted. Second, the resistance is not a single line, but a dense resistance zone of four points: 103-107. Counting upwards: ① The upper edge of the long-term downtrend line itself (103-104); ② The upper rail/wave projection target of the upward channel itself—the purple channel extends from 67.04 to the present, reaching the target area of the upper edge of the channel; ③ The 0.236 Fibonacci retracement level at 104.66; ④ The previous high at 106.75. Four resistance levels are squeezed into a range of less than 4 yuan. The suppressive force of this multiple resonance level is far greater than that of a single technical level, making it difficult for the price to break through in one go. Third, momentum is diverging, and the apparent "strong rise" is actually due to exhaustion. Note a few details: After the price surged to 106.75 in September, it failed to continue to make new highs, instead consolidating in the 100-103 range for almost a month; although the MACD is still above the zero line, the red bars have narrowed significantly from the September high, and the gap between the DIFF and DEA is narrowing; the RSI can't go higher above 62, and although the price barely makes a new high, the RSI doesn't rise in tandem—this is a typical early form of top divergence. The all-bullish moving average alignment looks good, but moving averages are lagging indicators. They confirm the gains of the past three months and do not indicate that the major downtrend has reversed. What we really need to be wary of is that a rebound in a major downtrend, reaching a point of multiple resistance zones and momentum divergence, is often where the rebound ends. Fourth, two possible outcomes for the direction. Only if the price closes above 106.75 with significant volume can it be considered a true breakout of the downtrend line, opening up space to 113-114 – only then can we discuss a major trend reversal. However, as long as the price is pulled back within the 103-107 range, the major downtrend remains valid, with the first support level at 95-93 (0.382 retracement + MA30 convergence), followed by 87.5 (0.5 retracement + MA100/120 dense area) – that level is the watershed for determining whether this upward channel can be maintained. The current position is more like an observation window of "rebound peak, wait for pullback" rather than the starting point of a "trend start, go long".
Oil prices consolidated near recent highs as market concerns about an immediate US strike against Iran eased. However, the prolonged stalemate in negotiations and the persistent risk of escalation continued to support the market. Furthermore, talks between Saudi Arabia and Iran failed to yield substantial progress; no agreement was reached to stop Houthi attacks, nor did they ease tensions. Meanwhile, Houthi forces attacked a pumping station on the Saudi East-West oil pipeline and Riyadh airport yesterday. It's worth noting that the East-West pipeline is a key alternative oil export route; disruptions to the pipeline in September caused a significant surge in oil prices. Looking ahead: Middle East tensions and the possibility of another US strike will continue to support oil prices. Conversely, if the conflict between Saudi Arabia and the Houthis eases, or if the US-Iran negotiations unexpectedly achieve a major breakthrough, oil prices could experience a significant correction. Technical Analysis: The upward trend is hitting the ceiling of the long-term downtrend. First, the overall trend is downward, and the current rise is merely a rebound. The blue downtrend line extending from the March high near 120 has been suppressing the upper edge of the long-term downtrend channel for the entire six months. This round of rise, which started at 67.04 at the end of June, is essentially a reverse rebound wave running below this downtrend line—no matter how good the rise looks, it is still a corrective wave within a larger downtrend, not a trend reversal. Now, the price has reached around 101, hitting the foot of this downtrend line (currently located at approximately 103-104), meaning that the entire rebound wave is undergoing the ultimate test of whether the "big trend" is accepted. Second, the resistance is not a single line, but a dense resistance zone of four points: 103-107. Counting upwards: ① The upper edge of the long-term downtrend line itself (103-104); ② The upper rail/wave projection target of the upward channel itself—the purple channel extends from 67.04 to the present, reaching the target area of the upper edge of the channel; ③ The 0.236 Fibonacci retracement level at 104.66; ④ The previous high at 106.75. Four resistance levels are squeezed into a range of less than 4 yuan. The suppressive force of this multiple resonance level is far greater than that of a single technical level, making it difficult for the price to break through in one go. Third, momentum is diverging, and the apparent "strong rise" is actually due to exhaustion. Note a few details: After the price surged to 106.75 in September, it failed to continue to make new highs, instead consolidating in the 100-103 range for almost a month; although the MACD is still above the zero line, the red bars have narrowed significantly from the September high, and the gap between the DIFF and DEA is narrowing; the RSI can't go higher above 62, and although the price barely makes a new high, the RSI doesn't rise in tandem—this is a typical early form of top divergence. The all-bullish moving average alignment looks good, but moving averages are lagging indicators. They confirm the gains of the past three months and do not indicate that the major downtrend has reversed. What we really need to be wary of is that a rebound in a major downtrend, reaching a point of multiple resistance zones and momentum divergence, is often where the rebound ends. Fourth, two possible outcomes for the direction. Only if the price closes above 106.75 with significant volume can it be considered a true breakout of the downtrend line, opening up space to 113-114 – only then can we discuss a major trend reversal. However, as long as the price is pulled back within the 103-107 range, the major downtrend remains valid, with the first support level at 95-93 (0.382 retracement + MA30 convergence), followed by 87.5 (0.5 retracement + MA100/120 dense area) – that level is the watershed for determining whether this upward channel can be maintained. The current position is more like an observation window of "rebound peak, wait for pullback" rather than the starting point of a "trend start, go long".- Risk Warning and Disclaimer
- The market involves risk, and trading may not be suitable for all investors. This article is for reference only and does not constitute personal investment advice, nor does it take into account certain users’ specific investment objectives, financial situation, or other needs. Any investment decisions made based on this information are at your own risk.