The Fed's hawkish stance is weighing on gold prices, with the market awaiting the release of US PCE data.
2026-10-29 10:26:24
Gold traded around $4,050 in early Asian trading on Thursday, failing to sustain the previous day's rebound driven by falling oil prices and easing inflation concerns. The key to this level lies in the Federal Reserve's combination of "holding rates steady but using hawkish rhetoric," which precisely targets the most sensitive valuation aspect of non-interest-bearing assets. Warsh explicitly stated that "ensuring price stability does not depend on a fixed date on the calendar," and maintained a hard 2% PCE target, while also saying that "new monetary medicine is working" and inflation expectations are "moving in the right direction." This statement offers no timetable for a shift to easing, instead re-anchoring the policy path to data dependence—for gold, this means that the expectation of declining holding costs has been postponed, not canceled.  From the perspective of suppressing factors, the core contradiction lies in the gap between "no action in the short term" and "no easing in the medium term." The inaction has already been fully priced in, so the decision itself failed to provide any incremental positive factors; what truly drives prices is the expected revision of the year-end path. Although the futures market no longer fully prices in three more rate hikes within this cycle, the probability of a December rate hike remains high, and US Treasury yields remain high. As OCBC points out, the current rebound in gold prices "especially considering the strengthening dollar and rising US Treasury yields," and the rebound in the technology sector may have alleviated broader selling pressure, but "US Treasury yields remain high, and the market continues to assign a high probability to a December rate hike." The bank also warned that "a hawkish Fed or another round of stock market deleveraging could quickly destroy this rebound"—a risk warning that seems particularly apt after Warsh's speech. The jump in the sentiment index indicates that the market interprets this press conference as a more resolute anti-inflationary stance than before, thus supporting bargain hunting for the dollar and passively pressuring gold. However, the downside potential for gold is also somewhat limited. On the one hand, precious metals as a whole remain at historically high levels, and the geopolitical risk premium in the Middle East has not subsided—the Houthi attacks on the Rastanura oil refinery and Aden airport, the disruption of traffic in the Strait of Hormuz, and the policy window following the US midterm elections all constitute real sources of underlying demand. On the other hand, if Thursday's PCE data shows that core inflation is falling faster than expected, the negative foundation established by oil prices and the Fed's rhetoric will be weakened, and further easing of oil prices is one of the conditions listed by OCBC for prolonging the gold recovery. In a horizontal comparison, gold is currently in a better position than silver: it can still rely on its safe-haven attributes and inflation hedging to gain some buffer, while silver's industrial attributes make it more vulnerable to selling in the combination of "slowing growth + rising costs," which is also the underlying reason for the recent widening of the gold-silver ratio. From a cross-asset perspective, the current volatility in gold is essentially a confluence of four factors: first, valuation pressure from real interest rates and the US dollar index; second, changes in holding costs transmitted through inflation in the oil market; third, liquidity selling pressure triggered by deleveraging risks in the stock market; and fourth, the support provided by geopolitical premiums. It's worth noting that this structure makes gold more suitable for phased positioning rather than one-sided betting: when the US dollar, US Treasury yields, and oil prices strengthen in tandem, gold prices tend to decline gradually; only when real interest rates fall and geopolitical risk premiums begin to shift towards safe-haven assets can a trend-driven rebound be established. Investors should not view single-day declines in isolation but rather assess them within the transmission chain of "Federal Reserve rhetoric—PCE—real interest rates—oil prices—safe-haven demand." On the daily chart, gold is trading around $4,050, with an overall bearish bias. The price is trading below the 20-day Bollinger Band (around $4,120) and the 100-day moving average (around $4,218), indicating that the rebound is limited and the market is in a correction phase. The RSI (14) is around 40, below the 50 midline but not yet in oversold territory, suggesting that while the bears are in control, there is still room for further decline, and intermittent corrective rebounds are likely to occur during the process. This is a typical "bearish trend, indicators needing repair" pattern. The upper resistance levels to watch are the 20-day Bollinger Band middle line at around $4,120, the 100-day moving average at around $4,218, and the upper Bollinger Band at around $4,235 (a valid breakout is needed to restart the bullish trend). The lower support levels to watch are first the lower Bollinger Band at around $4,005 (a breach of this level would strengthen the bearish bias), followed by psychological levels such as $3,980 and $3,950. On the 4-hour chart, gold prices are slowly moving downwards along the short-term moving averages. The MACD histogram is close to the zero line, with the fast and slow lines repeatedly intertwined, indicating weak momentum. Currently, the price is fluctuating narrowly between 4,040 and 4,070. If it retraces to 4,005-4,020 and finds support, there is still a chance for a short-term upward attack on 4,090-4,120. If it breaks below 4,005 with significant volume, it may seek support at 3,980 or even 3,950.
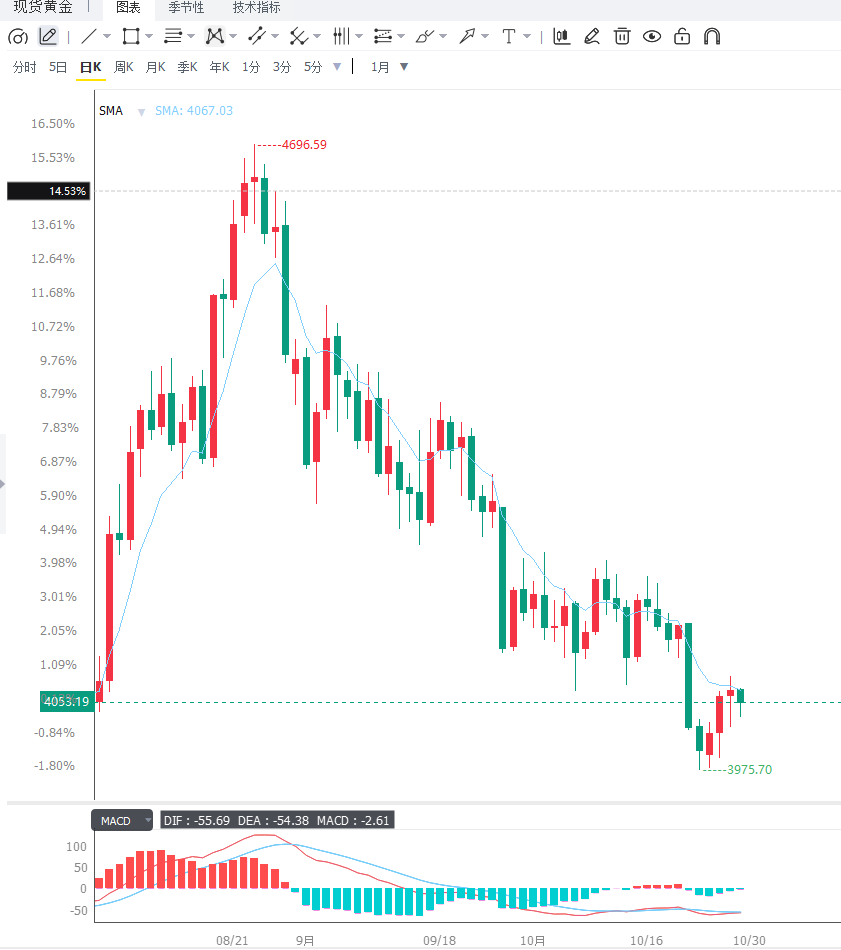 Editor's Summary: The core contradiction for gold in the short term lies in the hawkish rhetoric of the Federal Reserve, the high yields of US Treasury bonds, and the expectation of a December rate hike, all of which exert downward pressure. Meanwhile, geopolitical risk premiums, potential positive factors in the PCE index, and the stabilization of technology stocks provide support. This dual-driven factor suggests that gold prices are more likely to consolidate within the $4,005-$4,120 range, awaiting a breakout after the data release. Three key variables need to be monitored: first, the upcoming release of the US September PCE price index (especially the core PCE), the strength or weakness of which will validate Warsh's assertion that "the monetary medicine is working" and directly determine the real interest rate criterion; second, whether gold prices can hold above the lower Bollinger Band at $4,005, a primary technical indicator of whether the bearish momentum will continue; and third, the situation in the Middle East and the trend of oil prices, which are the real sources of demand for safe-haven assets. In addition, the US dollar index, US Treasury real yields, the risk of deleveraging in the stock market, whether silver can stabilize, and the policy window after the midterm elections also need to be monitored.
From the perspective of suppressing factors, the core contradiction lies in the gap between "no action in the short term" and "no easing in the medium term." The inaction has already been fully priced in, so the decision itself failed to provide any incremental positive factors; what truly drives prices is the expected revision of the year-end path. Although the futures market no longer fully prices in three more rate hikes within this cycle, the probability of a December rate hike remains high, and US Treasury yields remain high. As OCBC points out, the current rebound in gold prices "especially considering the strengthening dollar and rising US Treasury yields," and the rebound in the technology sector may have alleviated broader selling pressure, but "US Treasury yields remain high, and the market continues to assign a high probability to a December rate hike." The bank also warned that "a hawkish Fed or another round of stock market deleveraging could quickly destroy this rebound"—a risk warning that seems particularly apt after Warsh's speech. The jump in the sentiment index indicates that the market interprets this press conference as a more resolute anti-inflationary stance than before, thus supporting bargain hunting for the dollar and passively pressuring gold. However, the downside potential for gold is also somewhat limited. On the one hand, precious metals as a whole remain at historically high levels, and the geopolitical risk premium in the Middle East has not subsided—the Houthi attacks on the Rastanura oil refinery and Aden airport, the disruption of traffic in the Strait of Hormuz, and the policy window following the US midterm elections all constitute real sources of underlying demand. On the other hand, if Thursday's PCE data shows that core inflation is falling faster than expected, the negative foundation established by oil prices and the Fed's rhetoric will be weakened, and further easing of oil prices is one of the conditions listed by OCBC for prolonging the gold recovery. In a horizontal comparison, gold is currently in a better position than silver: it can still rely on its safe-haven attributes and inflation hedging to gain some buffer, while silver's industrial attributes make it more vulnerable to selling in the combination of "slowing growth + rising costs," which is also the underlying reason for the recent widening of the gold-silver ratio. From a cross-asset perspective, the current volatility in gold is essentially a confluence of four factors: first, valuation pressure from real interest rates and the US dollar index; second, changes in holding costs transmitted through inflation in the oil market; third, liquidity selling pressure triggered by deleveraging risks in the stock market; and fourth, the support provided by geopolitical premiums. It's worth noting that this structure makes gold more suitable for phased positioning rather than one-sided betting: when the US dollar, US Treasury yields, and oil prices strengthen in tandem, gold prices tend to decline gradually; only when real interest rates fall and geopolitical risk premiums begin to shift towards safe-haven assets can a trend-driven rebound be established. Investors should not view single-day declines in isolation but rather assess them within the transmission chain of "Federal Reserve rhetoric—PCE—real interest rates—oil prices—safe-haven demand." On the daily chart, gold is trading around $4,050, with an overall bearish bias. The price is trading below the 20-day Bollinger Band (around $4,120) and the 100-day moving average (around $4,218), indicating that the rebound is limited and the market is in a correction phase. The RSI (14) is around 40, below the 50 midline but not yet in oversold territory, suggesting that while the bears are in control, there is still room for further decline, and intermittent corrective rebounds are likely to occur during the process. This is a typical "bearish trend, indicators needing repair" pattern. The upper resistance levels to watch are the 20-day Bollinger Band middle line at around $4,120, the 100-day moving average at around $4,218, and the upper Bollinger Band at around $4,235 (a valid breakout is needed to restart the bullish trend). The lower support levels to watch are first the lower Bollinger Band at around $4,005 (a breach of this level would strengthen the bearish bias), followed by psychological levels such as $3,980 and $3,950. On the 4-hour chart, gold prices are slowly moving downwards along the short-term moving averages. The MACD histogram is close to the zero line, with the fast and slow lines repeatedly intertwined, indicating weak momentum. Currently, the price is fluctuating narrowly between 4,040 and 4,070. If it retraces to 4,005-4,020 and finds support, there is still a chance for a short-term upward attack on 4,090-4,120. If it breaks below 4,005 with significant volume, it may seek support at 3,980 or even 3,950. Editor's Summary: The core contradiction for gold in the short term lies in the hawkish rhetoric of the Federal Reserve, the high yields of US Treasury bonds, and the expectation of a December rate hike, all of which exert downward pressure. Meanwhile, geopolitical risk premiums, potential positive factors in the PCE index, and the stabilization of technology stocks provide support. This dual-driven factor suggests that gold prices are more likely to consolidate within the $4,005-$4,120 range, awaiting a breakout after the data release. Three key variables need to be monitored: first, the upcoming release of the US September PCE price index (especially the core PCE), the strength or weakness of which will validate Warsh's assertion that "the monetary medicine is working" and directly determine the real interest rate criterion; second, whether gold prices can hold above the lower Bollinger Band at $4,005, a primary technical indicator of whether the bearish momentum will continue; and third, the situation in the Middle East and the trend of oil prices, which are the real sources of demand for safe-haven assets. In addition, the US dollar index, US Treasury real yields, the risk of deleveraging in the stock market, whether silver can stabilize, and the policy window after the midterm elections also need to be monitored.
- Risk Warning and Disclaimer
- The market involves risk, and trading may not be suitable for all investors. This article is for reference only and does not constitute personal investment advice, nor does it take into account certain users’ specific investment objectives, financial situation, or other needs. Any investment decisions made based on this information are at your own risk.