Interest rate hikes and oil prices are supporting the Canadian dollar, causing the USD/CAD pair to return to the lower end of its trading range.
2026-10-29 14:30:23
On Thursday morning in Asia, the USD/CAD pair traded around 1.3990, fluctuating around the previous day's close of 1.3992. The core driver of this pullback came from two sources of support for the Canadian dollar: first, the Bank of Canada raised interest rates by 25 basis points to 2.50% at its October meeting, with Governor Macklem explicitly stating that "further rate hikes may be necessary," but given the uncertainty of the economic outlook, they would proceed cautiously; second, oil prices remained high, driven by geopolitical risks, with WTI trading around $101.20 per barrel. As a major oil exporter, Canada directly benefits from rising oil prices.  From the Bank of Canada's perspective, the decision-making logic behind this interest rate hike clearly points to the risk of energy price transmission. The statement explicitly states that the Middle East conflict is pushing up energy prices and prolonging their high levels, with the increased risk of costs being passed on to a wider range of goods and services being the core consideration. BBH analysts point out that the average year-on-year increase in the September trimmed mean CPI and median CPI was 1.85%, slightly lower than the Bank of Canada's Q3 forecast of 2.0%, but rising corporate inflation expectations over the next one to two years could push up the core CPI outlook, strengthening the case for further rate hikes. The Bank of Canada also raised its 2027 CPI forecast to 3.1% (from 2.0%) and slightly increased its global GDP growth forecast to 3.1% in 2026. This "cautiously hawkish" shift has caused the market to adjust its pricing of the subsequent rate hike path, providing structural support for the Canadian dollar. From the US dollar's perspective, the Federal Reserve maintained its interest rate at 3.75%-4.00%, but Warsh's wording at the press conference was firm, emphasizing that "ensuring price stability is not about a fixed date on the calendar" and reiterating the inviolability of the 2% PCE target. The FXS Fed Sentiment Index jumped 14.39 points to 141.89, well above the neutral 100 level, indicating a deeper hawkish policy stance. The CME FedWatch tool shows an 80%-85% probability of a December rate hike, meaning the dollar's strength is not solely due to risk aversion, but rather structural support based on interest rate differential expectations. However, the upside potential for USD/CAD is significantly constrained by oil prices—when WTI remains above $100, the Canadian dollar's commodity currency nature provides a natural hedge against the dollar. In a horizontal comparison, USD/CAD currently exhibits a typical "two-way tug-of-war" characteristic. On one hand, the Fed's hawkish stance and safe-haven demand support the dollar; on the other hand, the Bank of Canada's rate hikes and high oil prices support the Canadian dollar. This pattern makes the exchange rate more likely to fluctuate within a range rather than exhibit a smooth, one-sided trend. From the perspective of cross-asset correlation, the current fluctuation of USD/CAD is essentially the superposition of four clues: first, the marginal change in the expected interest rate differential between the US and Canada; second, the real-time evolution of WTI crude oil prices and Middle East geopolitical risks; third, the verification of the year-end interest rate hike path by the US Q3 GDP and PCE data; and fourth, the decision-making rhythm of subsequent meetings of the Bank of Canada. Only when two or more of these clues resonate in the same direction can a trending market have a basis. On the daily chart, USD/CAD is trading around 1.3990, with an overall bearish bias. The price is running below the 100-day simple moving average (SMA) at about 1.4045, and is also below the middle Bollinger Band at about 1.4140-1.4170, indicating that the bears still dominate. The RSI (14) is about 38.5, which is in the weak momentum zone but has not entered the oversold zone, suggesting that downward pressure exists but the slope may slow down. The upside resistance levels to watch are the 100-day SMA around 1.4045 (the primary resistance level), the Bollinger Band middle line around 1.4140-1.4170, and the Bollinger Band upper line around 1.4350-1.4355 (a decisive break above these levels is needed to reverse the bearish trend). On the downside, the first support level to watch is the lower Bollinger Band around 1.3930. A break below this level could open up further downside potential, testing the 1.3900 and even 1.3850 area. On the 4-hour chart, the price is moving along the short-term moving averages, and the MACD histogram is close to the zero line, indicating bearish momentum but no confirmed acceleration. Currently, the price is oscillating narrowly between 1.3960 and 1.4000. If a rebound to 1.4045 is met with resistance, consider shorting. If a pullback to 1.3930 provides support, the price may stabilize in the short term.
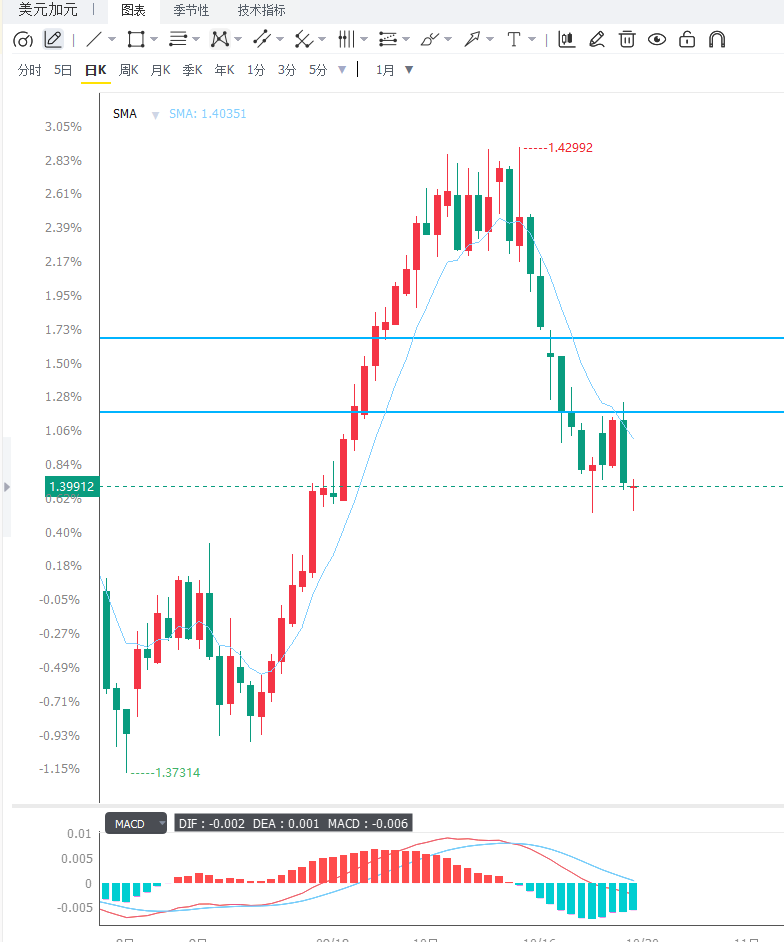 Editor's Summary: The core contradiction in the short-term USD/CAD exchange rate lies in the Fed's hawkish stance and safe-haven demand supporting the US dollar, while the Bank of Canada's interest rate hikes and high oil prices support the Canadian dollar. This two-way driver makes the exchange rate more likely to consolidate within the 1.3930-1.4045 range, awaiting a breakout from US data and oil price movements. Three key variables to watch go forward: first, the upcoming release of the US Q3 preliminary GDP and September core PCE price index; the strength or weakness of these data will directly validate the rationality of the Fed's year-end interest rate hike path; second, whether WTI crude oil can hold the $100 mark, which is the primary basis for judging whether the Canadian dollar's commodity-like support continues; and third, whether the exchange rate can effectively break through the 100-day SMA of 1.4045, which is the primary technical basis for judging whether the bearish trend has reversed.
From the Bank of Canada's perspective, the decision-making logic behind this interest rate hike clearly points to the risk of energy price transmission. The statement explicitly states that the Middle East conflict is pushing up energy prices and prolonging their high levels, with the increased risk of costs being passed on to a wider range of goods and services being the core consideration. BBH analysts point out that the average year-on-year increase in the September trimmed mean CPI and median CPI was 1.85%, slightly lower than the Bank of Canada's Q3 forecast of 2.0%, but rising corporate inflation expectations over the next one to two years could push up the core CPI outlook, strengthening the case for further rate hikes. The Bank of Canada also raised its 2027 CPI forecast to 3.1% (from 2.0%) and slightly increased its global GDP growth forecast to 3.1% in 2026. This "cautiously hawkish" shift has caused the market to adjust its pricing of the subsequent rate hike path, providing structural support for the Canadian dollar. From the US dollar's perspective, the Federal Reserve maintained its interest rate at 3.75%-4.00%, but Warsh's wording at the press conference was firm, emphasizing that "ensuring price stability is not about a fixed date on the calendar" and reiterating the inviolability of the 2% PCE target. The FXS Fed Sentiment Index jumped 14.39 points to 141.89, well above the neutral 100 level, indicating a deeper hawkish policy stance. The CME FedWatch tool shows an 80%-85% probability of a December rate hike, meaning the dollar's strength is not solely due to risk aversion, but rather structural support based on interest rate differential expectations. However, the upside potential for USD/CAD is significantly constrained by oil prices—when WTI remains above $100, the Canadian dollar's commodity currency nature provides a natural hedge against the dollar. In a horizontal comparison, USD/CAD currently exhibits a typical "two-way tug-of-war" characteristic. On one hand, the Fed's hawkish stance and safe-haven demand support the dollar; on the other hand, the Bank of Canada's rate hikes and high oil prices support the Canadian dollar. This pattern makes the exchange rate more likely to fluctuate within a range rather than exhibit a smooth, one-sided trend. From the perspective of cross-asset correlation, the current fluctuation of USD/CAD is essentially the superposition of four clues: first, the marginal change in the expected interest rate differential between the US and Canada; second, the real-time evolution of WTI crude oil prices and Middle East geopolitical risks; third, the verification of the year-end interest rate hike path by the US Q3 GDP and PCE data; and fourth, the decision-making rhythm of subsequent meetings of the Bank of Canada. Only when two or more of these clues resonate in the same direction can a trending market have a basis. On the daily chart, USD/CAD is trading around 1.3990, with an overall bearish bias. The price is running below the 100-day simple moving average (SMA) at about 1.4045, and is also below the middle Bollinger Band at about 1.4140-1.4170, indicating that the bears still dominate. The RSI (14) is about 38.5, which is in the weak momentum zone but has not entered the oversold zone, suggesting that downward pressure exists but the slope may slow down. The upside resistance levels to watch are the 100-day SMA around 1.4045 (the primary resistance level), the Bollinger Band middle line around 1.4140-1.4170, and the Bollinger Band upper line around 1.4350-1.4355 (a decisive break above these levels is needed to reverse the bearish trend). On the downside, the first support level to watch is the lower Bollinger Band around 1.3930. A break below this level could open up further downside potential, testing the 1.3900 and even 1.3850 area. On the 4-hour chart, the price is moving along the short-term moving averages, and the MACD histogram is close to the zero line, indicating bearish momentum but no confirmed acceleration. Currently, the price is oscillating narrowly between 1.3960 and 1.4000. If a rebound to 1.4045 is met with resistance, consider shorting. If a pullback to 1.3930 provides support, the price may stabilize in the short term. Editor's Summary: The core contradiction in the short-term USD/CAD exchange rate lies in the Fed's hawkish stance and safe-haven demand supporting the US dollar, while the Bank of Canada's interest rate hikes and high oil prices support the Canadian dollar. This two-way driver makes the exchange rate more likely to consolidate within the 1.3930-1.4045 range, awaiting a breakout from US data and oil price movements. Three key variables to watch go forward: first, the upcoming release of the US Q3 preliminary GDP and September core PCE price index; the strength or weakness of these data will directly validate the rationality of the Fed's year-end interest rate hike path; second, whether WTI crude oil can hold the $100 mark, which is the primary basis for judging whether the Canadian dollar's commodity-like support continues; and third, whether the exchange rate can effectively break through the 100-day SMA of 1.4045, which is the primary technical basis for judging whether the bearish trend has reversed.
- Risk Warning and Disclaimer
- The market involves risk, and trading may not be suitable for all investors. This article is for reference only and does not constitute personal investment advice, nor does it take into account certain users’ specific investment objectives, financial situation, or other needs. Any investment decisions made based on this information are at your own risk.