Crude oil trading alert: Geopolitical premiums and the dollar's high-level fluctuations are pulling in both directions, causing US crude oil prices to continue rising.
2026-10-30 09:58:25
WTI crude oil prices fell below $102 per barrel in Asian trading on Thursday, even briefly dipping below the $100 mark, before quickly recovering on buying support. It rallied again to $104.70 in early Friday trading, indicating that the market has not yet priced in the "tail risk of Middle East supply disruptions." A direct catalyst came from a new round of attacks by the Houthi rebels: they claimed to have launched ballistic missile attacks on the Rastanura refinery in Saudi Arabia's eastern province, the Abqaiq facility, and the Rabigh refinery on the Red Sea coast, as well as strikes on Riyadh and Dammam airports. The Rastanura refinery, with a daily processing capacity of approximately 550,000 barrels, is a key node in Saudi Arabia's energy export system; even though the actual damage is yet to be verified, as long as the facility faces a continued missile threat, the market will continue to factor in a safety premium.  From a supply structure perspective, the current crude oil market is not solely driven by sentiment; fundamentals also provide support at the bottom. EIA data shows that as of the week ending October 16, US commercial crude oil inventories fell by 3.06 million barrels to 412.5 million barrels, about 3% lower than the five-year average for the same period; gasoline inventories also fell by 3 million barrels, indicating that demand remains resilient. Regarding OPEC+, the seven core oil-producing countries decided to maintain their November production quotas at 31.01 million barrels per day, with Saudi Arabia and Russia maintaining their quotas at 10.478 million barrels per day and 9.949 million barrels per day, respectively. More importantly, quotas do not equal actual production—affected by shipping disruptions in the Strait of Hormuz and regional conflicts, Gulf oil-producing countries' actual exports have long been lower than their nominal quotas, and the spot market remains structurally tight. From a macroeconomic perspective, oil prices are currently facing pressure from a stronger US dollar. US Q3 GDP annualized growth reached 3.4%, and September core PCE rose 3.1% year-on-year, reinforcing the Federal Reserve's rationale for maintaining high interest rates, with the US dollar index holding steady above 102. A stronger US dollar is putting valuation pressure on dollar-denominated commodities, a key reason why WTI failed to sustain a larger upward trend. Furthermore, high freight rates are becoming a marginal constraint: Middle East conflicts are driving up shipping insurance costs and detour fees, and rising refinery landed costs may compress profit margins, thereby suppressing operating rates and crude oil procurement demand. This means that the closer oil prices get to the high resistance zone, the easier it is to trigger the demand-damage feedback mechanism. In a horizontal comparison, the Brent-WTI spread remains in the $8-9/barrel range, reflecting the higher sensitivity of European and Asian markets to Middle East supply disruptions. Brent, as the global pricing benchmark, more directly reflects geopolitical risks. From a cross-asset perspective, the current pricing logic for crude oil is a combination of four factors: first, the real-time evolution of Middle East geopolitical risks and risk premium pricing; second, the structural support from US inventory reduction and tight actual supply from OPEC+; third, the suppression of valuations by a strong US dollar; and fourth, the constraint on upside potential by freight rates and refinery profits. Only when geopolitical risks escalate further or inventory data continues to decline beyond expectations will oil prices have the basis to break through the upper Bollinger Band. On the daily chart, WTI crude oil is trading around $104 per barrel, with an overall bullish bias. The price is running above the 100-day SMA and the 20-day Bollinger Band middle line at around $96.15, and the bullish structure is intact. The RSI (14) is around 63.8, which is in the bullish zone but has not entered overbought territory, suggesting that there is still room for upward movement, but short-term consolidation is possible. The upper resistance level to watch is the upper Bollinger Band at around $105.55 (the first key level in the near term). Only a valid breakout can open up further upward space and challenge the previous high of $112.95. The lower support level to watch is first the $102-$103 range (the upper edge of the previous consolidation platform, which has turned into support after the breakout), followed by the $100 psychological and technical support level. If a deeper pullback occurs, it will test the structural support zone formed by the 20-day Bollinger Band middle line at around $96.15, the lower Bollinger Band at around $86.78, and the 100-day SMA at around $85.50. On the 4-hour chart, oil prices have broken through the $103-$104 resistance zone, and short-term bullish momentum has strengthened; however, the RSI is close to a high level, and if it cannot effectively hold above $104, profit-taking may occur, and prices may fall back to the $102-$103 range.
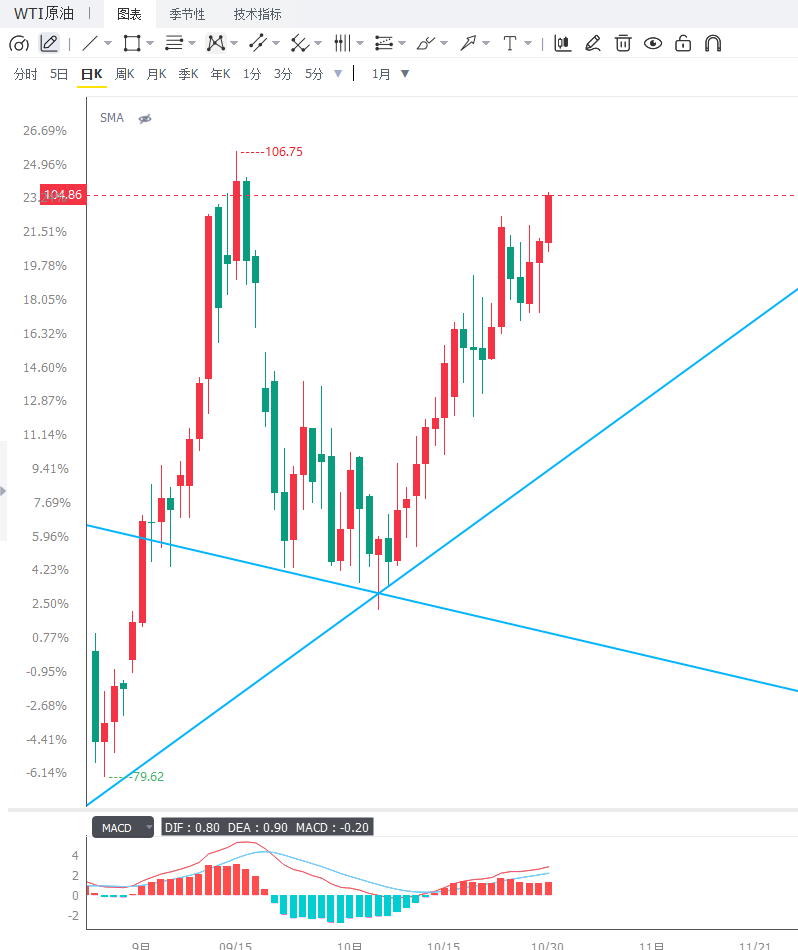 The editor summarizes that the core contradiction in the short term for WTI crude oil lies in the tug-of-war between the renewed geopolitical risk premium, a stronger US dollar, and freight cost constraints. Oil prices are more likely to fluctuate and consolidate at higher levels within the $102-$105.55 range. Three key variables need to be monitored: first, the frequency of Houthi attacks and the navigation situation in the Strait of Hormuz, which is the primary indicator of whether the geopolitical premium can continue to push up oil prices; second, the trend of the US dollar index and US Treasury yields, as a break above 102.55 by the dollar would exert additional downward pressure on oil prices; and third, whether oil prices can effectively break through and hold above the upper Bollinger Band at $105.55, which is the primary technical indicator of whether the bullish trend is accelerating. In addition, EIA inventory data, signals from the OPEC+ November meeting, changes in refinery utilization rates, and the policy window following the US midterm elections also need to be monitored.
From a supply structure perspective, the current crude oil market is not solely driven by sentiment; fundamentals also provide support at the bottom. EIA data shows that as of the week ending October 16, US commercial crude oil inventories fell by 3.06 million barrels to 412.5 million barrels, about 3% lower than the five-year average for the same period; gasoline inventories also fell by 3 million barrels, indicating that demand remains resilient. Regarding OPEC+, the seven core oil-producing countries decided to maintain their November production quotas at 31.01 million barrels per day, with Saudi Arabia and Russia maintaining their quotas at 10.478 million barrels per day and 9.949 million barrels per day, respectively. More importantly, quotas do not equal actual production—affected by shipping disruptions in the Strait of Hormuz and regional conflicts, Gulf oil-producing countries' actual exports have long been lower than their nominal quotas, and the spot market remains structurally tight. From a macroeconomic perspective, oil prices are currently facing pressure from a stronger US dollar. US Q3 GDP annualized growth reached 3.4%, and September core PCE rose 3.1% year-on-year, reinforcing the Federal Reserve's rationale for maintaining high interest rates, with the US dollar index holding steady above 102. A stronger US dollar is putting valuation pressure on dollar-denominated commodities, a key reason why WTI failed to sustain a larger upward trend. Furthermore, high freight rates are becoming a marginal constraint: Middle East conflicts are driving up shipping insurance costs and detour fees, and rising refinery landed costs may compress profit margins, thereby suppressing operating rates and crude oil procurement demand. This means that the closer oil prices get to the high resistance zone, the easier it is to trigger the demand-damage feedback mechanism. In a horizontal comparison, the Brent-WTI spread remains in the $8-9/barrel range, reflecting the higher sensitivity of European and Asian markets to Middle East supply disruptions. Brent, as the global pricing benchmark, more directly reflects geopolitical risks. From a cross-asset perspective, the current pricing logic for crude oil is a combination of four factors: first, the real-time evolution of Middle East geopolitical risks and risk premium pricing; second, the structural support from US inventory reduction and tight actual supply from OPEC+; third, the suppression of valuations by a strong US dollar; and fourth, the constraint on upside potential by freight rates and refinery profits. Only when geopolitical risks escalate further or inventory data continues to decline beyond expectations will oil prices have the basis to break through the upper Bollinger Band. On the daily chart, WTI crude oil is trading around $104 per barrel, with an overall bullish bias. The price is running above the 100-day SMA and the 20-day Bollinger Band middle line at around $96.15, and the bullish structure is intact. The RSI (14) is around 63.8, which is in the bullish zone but has not entered overbought territory, suggesting that there is still room for upward movement, but short-term consolidation is possible. The upper resistance level to watch is the upper Bollinger Band at around $105.55 (the first key level in the near term). Only a valid breakout can open up further upward space and challenge the previous high of $112.95. The lower support level to watch is first the $102-$103 range (the upper edge of the previous consolidation platform, which has turned into support after the breakout), followed by the $100 psychological and technical support level. If a deeper pullback occurs, it will test the structural support zone formed by the 20-day Bollinger Band middle line at around $96.15, the lower Bollinger Band at around $86.78, and the 100-day SMA at around $85.50. On the 4-hour chart, oil prices have broken through the $103-$104 resistance zone, and short-term bullish momentum has strengthened; however, the RSI is close to a high level, and if it cannot effectively hold above $104, profit-taking may occur, and prices may fall back to the $102-$103 range. The editor summarizes that the core contradiction in the short term for WTI crude oil lies in the tug-of-war between the renewed geopolitical risk premium, a stronger US dollar, and freight cost constraints. Oil prices are more likely to fluctuate and consolidate at higher levels within the $102-$105.55 range. Three key variables need to be monitored: first, the frequency of Houthi attacks and the navigation situation in the Strait of Hormuz, which is the primary indicator of whether the geopolitical premium can continue to push up oil prices; second, the trend of the US dollar index and US Treasury yields, as a break above 102.55 by the dollar would exert additional downward pressure on oil prices; and third, whether oil prices can effectively break through and hold above the upper Bollinger Band at $105.55, which is the primary technical indicator of whether the bullish trend is accelerating. In addition, EIA inventory data, signals from the OPEC+ November meeting, changes in refinery utilization rates, and the policy window following the US midterm elections also need to be monitored.
- Risk Warning and Disclaimer
- The market involves risk, and trading may not be suitable for all investors. This article is for reference only and does not constitute personal investment advice, nor does it take into account certain users’ specific investment objectives, financial situation, or other needs. Any investment decisions made based on this information are at your own risk.