Vale's third quarter 2026 results
2026-10-30 11:54:28
Vale today released its third-quarter 2026 results. Rio de Janeiro, Brazil, October 29, 2026 – “Our third-quarter results reflect our strong execution of our corporate strategy and our continued focus on operational excellence. In a volatile market environment, our flexible product portfolio, along with our chartering and hedging strategies, helped protect our profit margins and supported robust cash flow generation, further strengthening our balance sheet. In our iron ore business, we are building a more flexible and competitive operating platform. The launch of the 20 million tonnes per annum capacity expansion project at Nanling, coupled with the commissioning of the compact crushing project, will further enhance the performance of S11D and solidify its position.” "Our status as a world-class asset. Thanks to the solid performance of our assets and the smooth progress of these projects, we are on track for a strong year-to-date finish. Vale's base metals continued their growth momentum, with Salobo achieving record production for the third quarter, and copper and nickel production expected to reach the upper half of our guidance range. With the approval of the Salobo coarse flotation project, we have taken another significant step on the path to growth in our copper business, leveraging our existing assets and infrastructure to achieve growth with high capital efficiency. These achievements collectively enhance Vale's resilience, enabling us to create sustainable value in the long term," said Mr. Gustavo Pimenta, CEO of Vale. 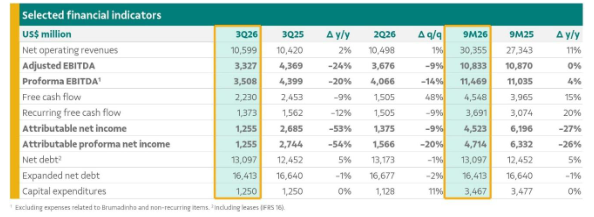
Performance Highlights
Strong sales performance. Iron ore sales increased by 0.3% year-on-year (300,000 tonnes), despite a 6% decrease in production (6 million tonnes) during the same period. Copper sales decreased by 4% year-on-year, in line with expectations, reflecting the impact of the planned rebuilding of the Sossego semi-autogenous mill. Nickel sales increased by 16.1% year-on-year (6,900 tonnes), driven by increased production. All production guidance targets for 2026 remain unchanged, with copper and nickel production expected to reach the upper half of the guidance range. Iron ore real prices were influenced by external factors. The average real price of iron ore fines was $85.1/tonne, down 10% both month-on-month and year-on-year, due to lower benchmark prices and temporary adjustments related to CFR (cost plus freight) sales. Copper real prices rose. The real price of copper rose to $15,314/tonne (up 9% month-on-month and 56% year-on-year), exceeding the increase in copper prices on the London Metal Exchange (LME). The actual price of nickel was $16,898/ton (down 6% month-on-month, up 9% year-on-year), with the higher premium partially offsetting the impact of the benchmark price decline. Iron ore costs were affected by the Brazilian real and oil prices. C1 cash costs were $23.1/ton (up 12% year-on-year), mainly reflecting the appreciation of the Brazilian real and the impact of diesel costs; total costs were $60.4/ton (up 21% year-on-year), further affected by rising shipping costs. Copper costs continued to improve. Total copper costs were -$175/ton, down $1,200/ton year-on-year, thanks to strong by-product revenue. Total nickel costs were $14,552/ton, up 18% year-on-year, in line with expectations, reflecting the impact of increased planned maintenance. Formal EBITDA (earnings before interest, taxes, depreciation, and amortization) was $3.5 billion , down 20% year-on-year and down 14% month-on-month, mainly affected by lower actual iron ore fines prices and external cost pressures such as the appreciation of the Brazilian real and rising marine fuel prices. Capital expenditures were $1.3 billion , flat year-over-year, with full-year investment expected to be at the lower end of the guidance range of $5.4 billion to $5.7 billion. Recurring free cash flow was $1.4 billion, down $200 million year-over-year, with successful hedging and working capital management partially offsetting the decline in formal EBITDA. Total free cash flow reached $2.2 billion. Extended net debt was $16.4 billion , down $200 million sequentially, driven by cash flow generation.- Risk Warning and Disclaimer
- The market involves risk, and trading may not be suitable for all investors. This article is for reference only and does not constitute personal investment advice, nor does it take into account certain users’ specific investment objectives, financial situation, or other needs. Any investment decisions made based on this information are at your own risk.