













Copper Price Forecast: Continued Concerns About AI Spending Risk to Price Rebound
2026-11-02 18:16:24
On Monday (November 2nd), copper prices rebounded after a sharp sell-off last Friday. The sell-off was triggered by market concerns about AI spending. The market is worried about whether the massive investments in artificial intelligence can generate sufficient profits. Since copper is heavily used in data center and power grid construction, this market concern is significant for copper.  Another risk facing the copper market comes from high interest rate expectations. High borrowing costs could hinder the progress of industrial infrastructure construction, thereby suppressing copper demand. This means that copper prices remain vulnerable to these risks; any rebound will be limited until prices achieve an upward breakout. Data shows that China's private manufacturing Purchasing Managers' Index (PMI) fell slightly to 52 in October from 52.1 in September. Meanwhile, the National Bureau of Statistics of China reported that the October manufacturing PMI declined to 49.2. In the medium term, the author believes that the pressure from the high-inflation environment is accumulating. However, the implementation and construction of AI projects are likely to boost copper demand, as the metal is consumed in large quantities in AI-related infrastructure. Copper price forecast: A sustained move above $6.95 may open up more room for upward movement.
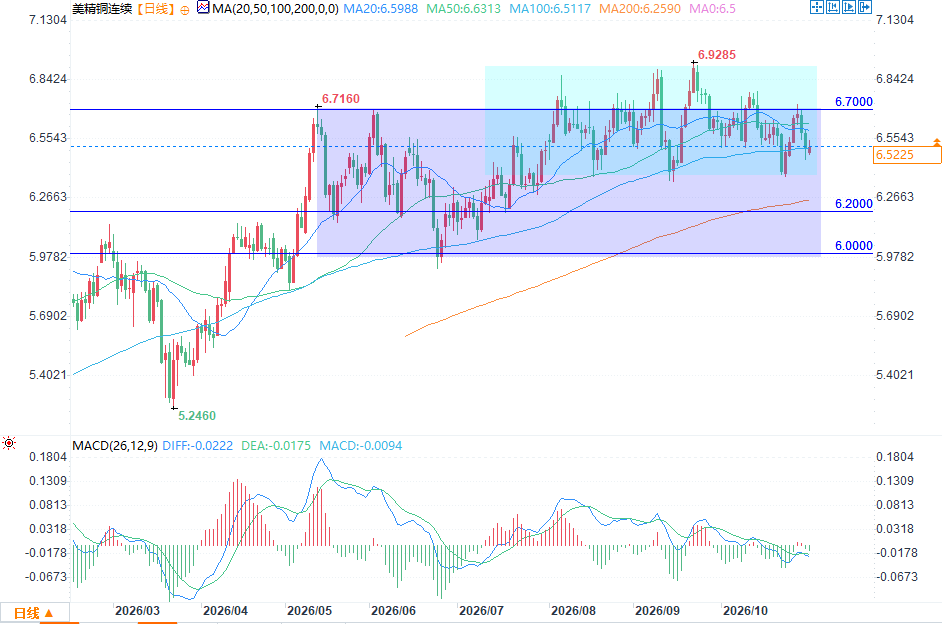 The daily chart for copper shows that since August 2026, copper prices have been consolidating within a range of $6.40-$6.95. A break above $6.95 could trigger a strong upward trend. Conversely, a drop below $6.40 could see copper prices fall to around $6.20, corresponding to the 200-day simple moving average. As long as copper prices remain above $6, the possibility of a further rise to $7.50 remains high. The potential driver of this upward trend is the large-scale construction of AI data centers, for which copper is a crucial industrial metal. Despite the overall bullish sentiment, the quarterly chart shows copper prices consolidating near a strong resistance level. Prices need to hold the $6 support level established by the ascending channel pattern. Copper prices rose 6.84% in the third quarter and are currently awaiting a directional move; only a break above $6.90 could propel prices higher.
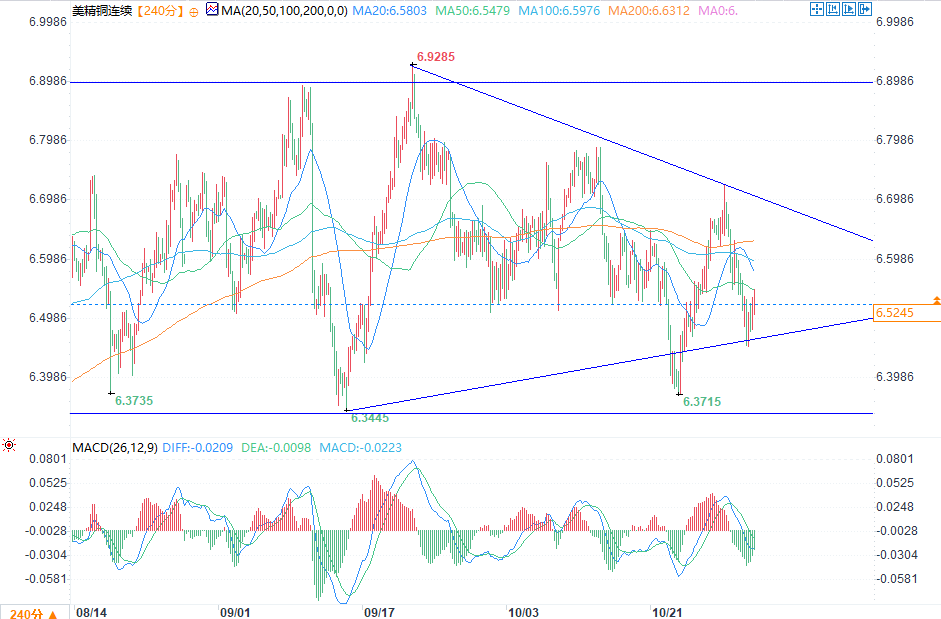 The 4-hour chart also shows consolidation characteristics, with copper prices awaiting the next direction. Trend lines indicate that the short-term trading range for copper may narrow further. Copper is outperforming gold and silver, with the price ratio continuing to rise. Even though copper prices continue to fluctuate between $6.40 and $6.95, compared to silver and gold, copper still shows relative strength. The copper-silver ratio confirms this: after finding a bottom near 0.064, the ratio has broken above 0.107. The copper-silver ratio rose by 21.22% in October and is expected to continue rising, targeting 0.1580. If the ratio subsequently forms a top, it may indicate that silver prices have bottomed out. Similarly, the copper-gold ratio found support at 0.0011 and continues to accelerate upwards; the long-term resistance level for this ratio is at 0.0019. Once this level is broken, the wedge pattern will be broken. However, if the ratio tops out near the resistance level, it suggests that gold prices may have bottomed out. Key Areas to Watch: Last Friday's large-scale sell-off in the technology sector triggered a short-term pullback in copper prices. However, over the past three months, copper prices have remained within the $6.40-$6.95 range. AI projects are expected to support copper demand, but high borrowing costs and a high-inflation environment pose risks to copper prices. In my view, copper prices must break through $6.95 to open up further upside potential; conversely, a drop below $6.40 could lead to a decline back to the $6-$6.20 range.
Another risk facing the copper market comes from high interest rate expectations. High borrowing costs could hinder the progress of industrial infrastructure construction, thereby suppressing copper demand. This means that copper prices remain vulnerable to these risks; any rebound will be limited until prices achieve an upward breakout. Data shows that China's private manufacturing Purchasing Managers' Index (PMI) fell slightly to 52 in October from 52.1 in September. Meanwhile, the National Bureau of Statistics of China reported that the October manufacturing PMI declined to 49.2. In the medium term, the author believes that the pressure from the high-inflation environment is accumulating. However, the implementation and construction of AI projects are likely to boost copper demand, as the metal is consumed in large quantities in AI-related infrastructure. Copper price forecast: A sustained move above $6.95 may open up more room for upward movement. The daily chart for copper shows that since August 2026, copper prices have been consolidating within a range of $6.40-$6.95. A break above $6.95 could trigger a strong upward trend. Conversely, a drop below $6.40 could see copper prices fall to around $6.20, corresponding to the 200-day simple moving average. As long as copper prices remain above $6, the possibility of a further rise to $7.50 remains high. The potential driver of this upward trend is the large-scale construction of AI data centers, for which copper is a crucial industrial metal. Despite the overall bullish sentiment, the quarterly chart shows copper prices consolidating near a strong resistance level. Prices need to hold the $6 support level established by the ascending channel pattern. Copper prices rose 6.84% in the third quarter and are currently awaiting a directional move; only a break above $6.90 could propel prices higher. The 4-hour chart also shows consolidation characteristics, with copper prices awaiting the next direction. Trend lines indicate that the short-term trading range for copper may narrow further. Copper is outperforming gold and silver, with the price ratio continuing to rise. Even though copper prices continue to fluctuate between $6.40 and $6.95, compared to silver and gold, copper still shows relative strength. The copper-silver ratio confirms this: after finding a bottom near 0.064, the ratio has broken above 0.107. The copper-silver ratio rose by 21.22% in October and is expected to continue rising, targeting 0.1580. If the ratio subsequently forms a top, it may indicate that silver prices have bottomed out. Similarly, the copper-gold ratio found support at 0.0011 and continues to accelerate upwards; the long-term resistance level for this ratio is at 0.0019. Once this level is broken, the wedge pattern will be broken. However, if the ratio tops out near the resistance level, it suggests that gold prices may have bottomed out. Key Areas to Watch: Last Friday's large-scale sell-off in the technology sector triggered a short-term pullback in copper prices. However, over the past three months, copper prices have remained within the $6.40-$6.95 range. AI projects are expected to support copper demand, but high borrowing costs and a high-inflation environment pose risks to copper prices. In my view, copper prices must break through $6.95 to open up further upside potential; conversely, a drop below $6.40 could lead to a decline back to the $6-$6.20 range.
- Risk Warning and Disclaimer
- The market involves risk, and trading may not be suitable for all investors. This article is for reference only and does not constitute personal investment advice, nor does it take into account certain users’ specific investment objectives, financial situation, or other needs. Any investment decisions made based on this information are at your own risk.