













Gold prices rebounded, while a sharp drop in oil prices dampened expectations of a Federal Reserve rate hike.
2026-11-03 01:18:25
On Monday (November 2), lower oil prices dragged down the US dollar index, providing further support for gold, a non-interest-bearing asset. Gold prices rebounded after last week's sharp decline, with traders shifting their focus from expectations of a Federal Reserve rate hike to weaker oil prices and the US midterm elections. 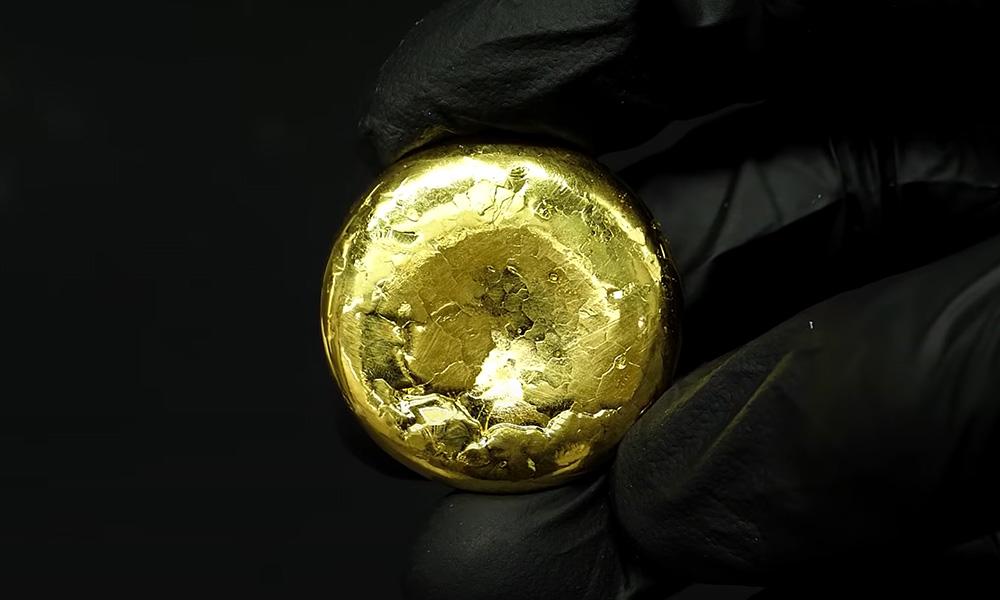 Gold prices hit a one-year low last Friday, but spot gold and gold futures both rose more than 2% in early trading on Monday. Early declines in crude oil prices eased market concerns about inflation, stimulating short covering and speculative buying. Meanwhile, some investors chose to close out positions ahead of Tuesday's US midterm elections, which may influence subsequent government policy. Lower oil prices suppress interest rate hike expectations The decline in oil prices has not yet changed market bets on a December rate hike, but it will affect market expectations for the total magnitude of rate hikes in this tightening cycle. Market expectations for a December rate hike have slightly decreased today, a change sufficient to suppress the dollar index and thus provide support for gold prices. Iran-Qatar talks pressure oil prices The core driver of this market movement comes from the oil market. Iran and Qatar held talks for the third consecutive day, aiming to achieve a ceasefire between the US and Iran. Affected by this news, WTI and Brent crude oil both fell by more than 6%. The cooling of expectations for declining inflation and rising interest rates are the core factors influencing today's market – both of which will affect the pricing of gold, a non-interest-bearing asset. Gold Price Outlook Some believe that the gold sell-off last Friday was triggered by a sharp decline in US tech stocks. The weakening stock market triggered margin calls, forcing hedge funds to sell gold to meet margin requirements. Other analysts point out that the main theme this week is the political risk brought about by the US midterm elections, the election results of which may influence US fiscal policy. However, some believe the election's impact will be limited: neither party is likely to address the current high US debt problem, and a high debt environment is a long-term positive for gold prices. Spot Gold Weekly Technical Analysis
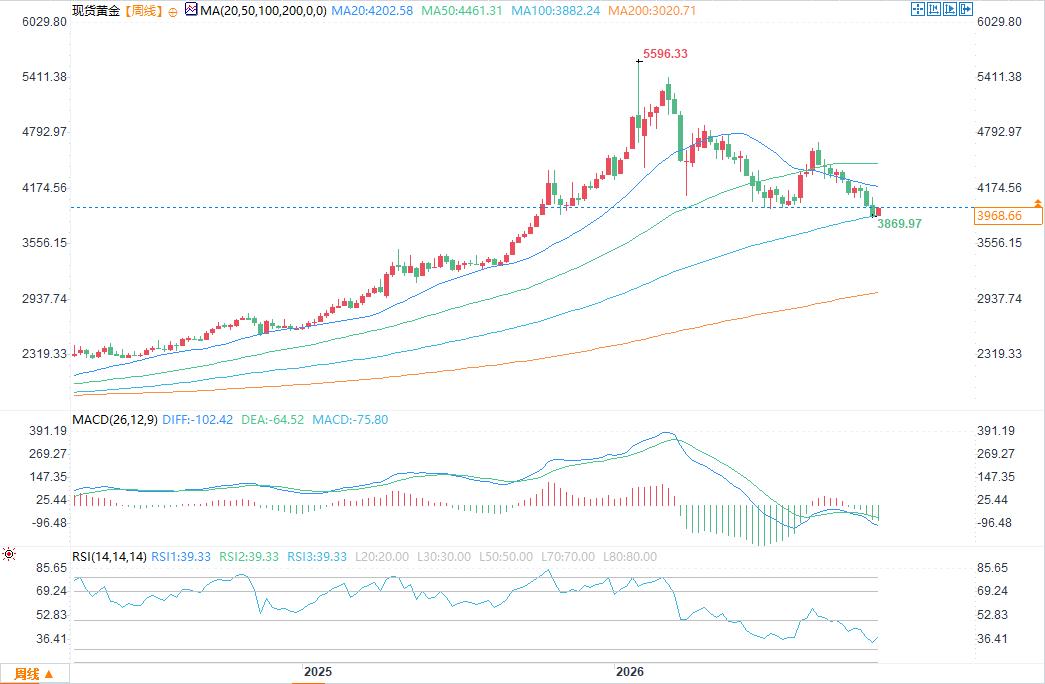 On Monday morning, spot gold rose slightly on the weekly chart after last week's sharp decline. The price found buying support before breaking last week's low, suggesting either bargain hunting or a technical reaction to oversold conditions. The weekly chart shows the overall trend remains downward. A break below $3870.32 would confirm a resumption of the downtrend; only a break above $4697.11 would signal an upward shift in the overall trend. The secondary trend is also downward. A firm hold above $4217.39 would reverse the secondary trend to bullish, likely leading to a bullish market. The current key trading range is the large wave formed by the November 2024 low of $2536.85 and the January 2026 high of $5602.23, with a retracement range of $4069.54 to $3707.82. Many long-term investors consider this range a value entry point. Resistance levels: The 52-week moving average at $4447.29 is a significant long-term trend resistance; the next key level is $4481.78, which is 20% below the historical high of $5602.23 and is considered the starting point of a bear market. Key areas to watch going forward:
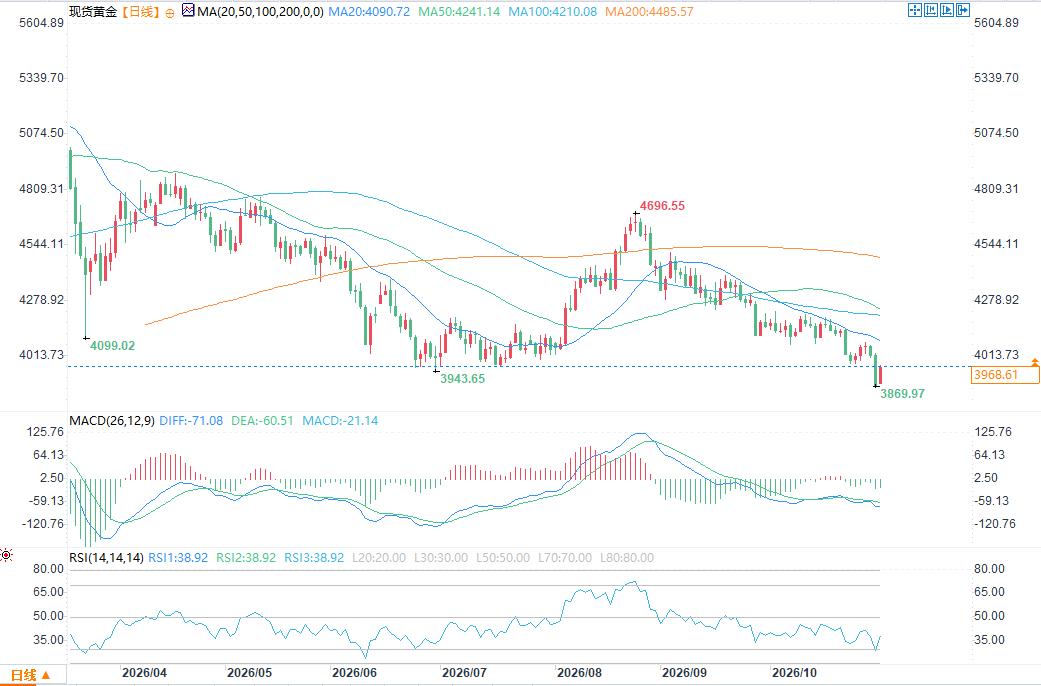 The overall trend is downward, with prices significantly below the 52-week moving average, coupled with confirmation of a bear market, suggesting a bearish bias. For value traders (both passive and active stop-loss orders), the key range to watch is $4069.54–$3707.82. The market's reaction within this range will reflect whether bulls are willing to actively absorb sell orders near $4069.54, or whether funds will passively buy at the 61.8% Fibonacci retracement level of $3707.82. A sustained move above $4069.54 would weaken bearish expectations; a break below $3707.82 would further strengthen the bearish outlook.
Gold prices hit a one-year low last Friday, but spot gold and gold futures both rose more than 2% in early trading on Monday. Early declines in crude oil prices eased market concerns about inflation, stimulating short covering and speculative buying. Meanwhile, some investors chose to close out positions ahead of Tuesday's US midterm elections, which may influence subsequent government policy. Lower oil prices suppress interest rate hike expectations The decline in oil prices has not yet changed market bets on a December rate hike, but it will affect market expectations for the total magnitude of rate hikes in this tightening cycle. Market expectations for a December rate hike have slightly decreased today, a change sufficient to suppress the dollar index and thus provide support for gold prices. Iran-Qatar talks pressure oil prices The core driver of this market movement comes from the oil market. Iran and Qatar held talks for the third consecutive day, aiming to achieve a ceasefire between the US and Iran. Affected by this news, WTI and Brent crude oil both fell by more than 6%. The cooling of expectations for declining inflation and rising interest rates are the core factors influencing today's market – both of which will affect the pricing of gold, a non-interest-bearing asset. Gold Price Outlook Some believe that the gold sell-off last Friday was triggered by a sharp decline in US tech stocks. The weakening stock market triggered margin calls, forcing hedge funds to sell gold to meet margin requirements. Other analysts point out that the main theme this week is the political risk brought about by the US midterm elections, the election results of which may influence US fiscal policy. However, some believe the election's impact will be limited: neither party is likely to address the current high US debt problem, and a high debt environment is a long-term positive for gold prices. Spot Gold Weekly Technical Analysis On Monday morning, spot gold rose slightly on the weekly chart after last week's sharp decline. The price found buying support before breaking last week's low, suggesting either bargain hunting or a technical reaction to oversold conditions. The weekly chart shows the overall trend remains downward. A break below $3870.32 would confirm a resumption of the downtrend; only a break above $4697.11 would signal an upward shift in the overall trend. The secondary trend is also downward. A firm hold above $4217.39 would reverse the secondary trend to bullish, likely leading to a bullish market. The current key trading range is the large wave formed by the November 2024 low of $2536.85 and the January 2026 high of $5602.23, with a retracement range of $4069.54 to $3707.82. Many long-term investors consider this range a value entry point. Resistance levels: The 52-week moving average at $4447.29 is a significant long-term trend resistance; the next key level is $4481.78, which is 20% below the historical high of $5602.23 and is considered the starting point of a bear market. Key areas to watch going forward: The overall trend is downward, with prices significantly below the 52-week moving average, coupled with confirmation of a bear market, suggesting a bearish bias. For value traders (both passive and active stop-loss orders), the key range to watch is $4069.54–$3707.82. The market's reaction within this range will reflect whether bulls are willing to actively absorb sell orders near $4069.54, or whether funds will passively buy at the 61.8% Fibonacci retracement level of $3707.82. A sustained move above $4069.54 would weaken bearish expectations; a break below $3707.82 would further strengthen the bearish outlook.
- Risk Warning and Disclaimer
- The market involves risk, and trading may not be suitable for all investors. This article is for reference only and does not constitute personal investment advice, nor does it take into account certain users’ specific investment objectives, financial situation, or other needs. Any investment decisions made based on this information are at your own risk.