













Gold demand diverged in the third quarter; what signals are hidden behind the record-breaking ETF sales?
2026-11-03 15:40:25
On Tuesday, November 3rd, spot gold prices, after a significant pullback from their January highs, are currently trading around $3,900, representing a decline of nearly 30% from their year-to-date peak. Continued conflict in the Middle East is pushing up energy costs and interest rate expectations, putting downward pressure on non-interest-bearing assets. However, official gold purchases accelerated significantly in the third quarter. The World Gold Council's latest quarterly demand trends report shows that global central banks and other official institutions net purchased 321 tons of gold in the third quarter, a 42% year-on-year increase, marking the highest quarterly increase since the fourth quarter of 2024. Cumulative purchases this year reached 675 tons, a 6% increase year-on-year. During the same period, the average gold price was $4,262 per ounce, with demand value increasing by 22% year-on-year to $188 billion. 
Central bank gold purchases become the core supporting force
Official gold purchases in the third quarter exceeded market expectations, becoming a major marginal support amid downward pressure on prices. Data from the World Gold Council shows that approximately two-thirds of purchases were not proactively disclosed by monetary authorities; estimates were primarily based on a combination of publicly available data, trade statistics, and on-site surveys. Among the major buyers who disclosed their purchases, central banks such as Poland made significant contributions, while some other institutions were net sellers. John Reid, senior market strategist at the World Gold Council, pointed out that the weakening gold price during the quarter may have prompted some central banks to increase their purchases; for reserve managers who are bearish on the dollar in the long term, the temporary strengthening of the dollar has actually increased the attractiveness of converting some maturing short-term government bonds into gold. Reid stated that if holders expect a long-term weakening dollar and the gradual maturity of short-term government bonds, they may shift some funds to gold allocations. This logic reflects that official gold purchases are more based on portfolio diversification and risk management needs than on short-term price fluctuations. The report also raised its full-year central bank gold purchase forecast, believing that the total amount in 2026 is likely to match at least the 848 tons level of 2025. The continued institutional demand, amidst a divergence in private investment intentions, has provided a relatively stable bottom support structure for spot gold.Diverging Investment Demand: Strong ETFs vs. Weak Physical Commodities
Investment demand in the third quarter showed a clear internal divergence. Physically backed gold ETFs recorded net inflows of 211 tons, bringing holdings to a record 4,256 tons, reversing the outflows of the second quarter and only 6% lower than the same period in 2025. Louise Street, senior market analyst at the World Gold Council, said geopolitical risks and concerns about fiscal discipline drove institutional funds back, while retail investors remained on the sidelines due to uncertainty about price direction. In contrast, demand for gold bars and coins fell 19% year-on-year to 268 tons, with the retail sector choosing to stand by in the absence of a clear trend. Jewelry demand was also under pressure, falling 17% year-on-year to 313 tons, marking the weakest third-quarter performance since the organization began tracking data. High prices and tax adjustments in some markets prompted consumers to switch to lighter, lower-purity products. Street pointed out that overall demand in the third quarter was mixed, with strong performance from ETFs contrasting with cautious retail sales, while central bank gold purchases continued to be an important pillar. Record ETF holdings reflect that some professional funds still regard gold as a stable allocation tool in their portfolios, even amid rising interest rates and geopolitical uncertainties.Supply-side dynamics and other demand dynamics
Overall supply contracted slightly. Mine output increased by 3% year-on-year to 1,071 tons, a record level for the third quarter, becoming the main source of supply growth; recycled gold decreased by 8% year-on-year to 314 tons, the lowest since 2023, indicating that high prices did not significantly stimulate the return of scrap gold. Total supply decreased by 1% year-on-year to 1,369 tons. Demand for gold in technology increased by 3% year-on-year to 85 tons, the highest since the fourth quarter of 2021, while gold for electronics increased by 5% to 72 tons, mainly supported by demand from AI-related manufacturing. The World Gold Council's outlook suggests that central bank gold purchases are likely to at least match last year's levels, jewelry demand will continue to be suppressed in a high-price environment, and recycled gold will remain relatively sluggish in its price response. Mine output is the only area on the supply side that may see moderate growth. Demand for ETFs, gold bars, and gold coins is expected to remain resilient, but will face the interplay of interest rates and geopolitical factors. Total demand for the year (including OTC) reached 3,881 tons, roughly on par with the 2025 record, while the demand value reached a new high of US$566 billion. This matching of supply and demand helps explain why prices have been able to maintain a relatively orderly adjustment pace despite continuous buying by official departments.Current Market Technical Pattern Observation
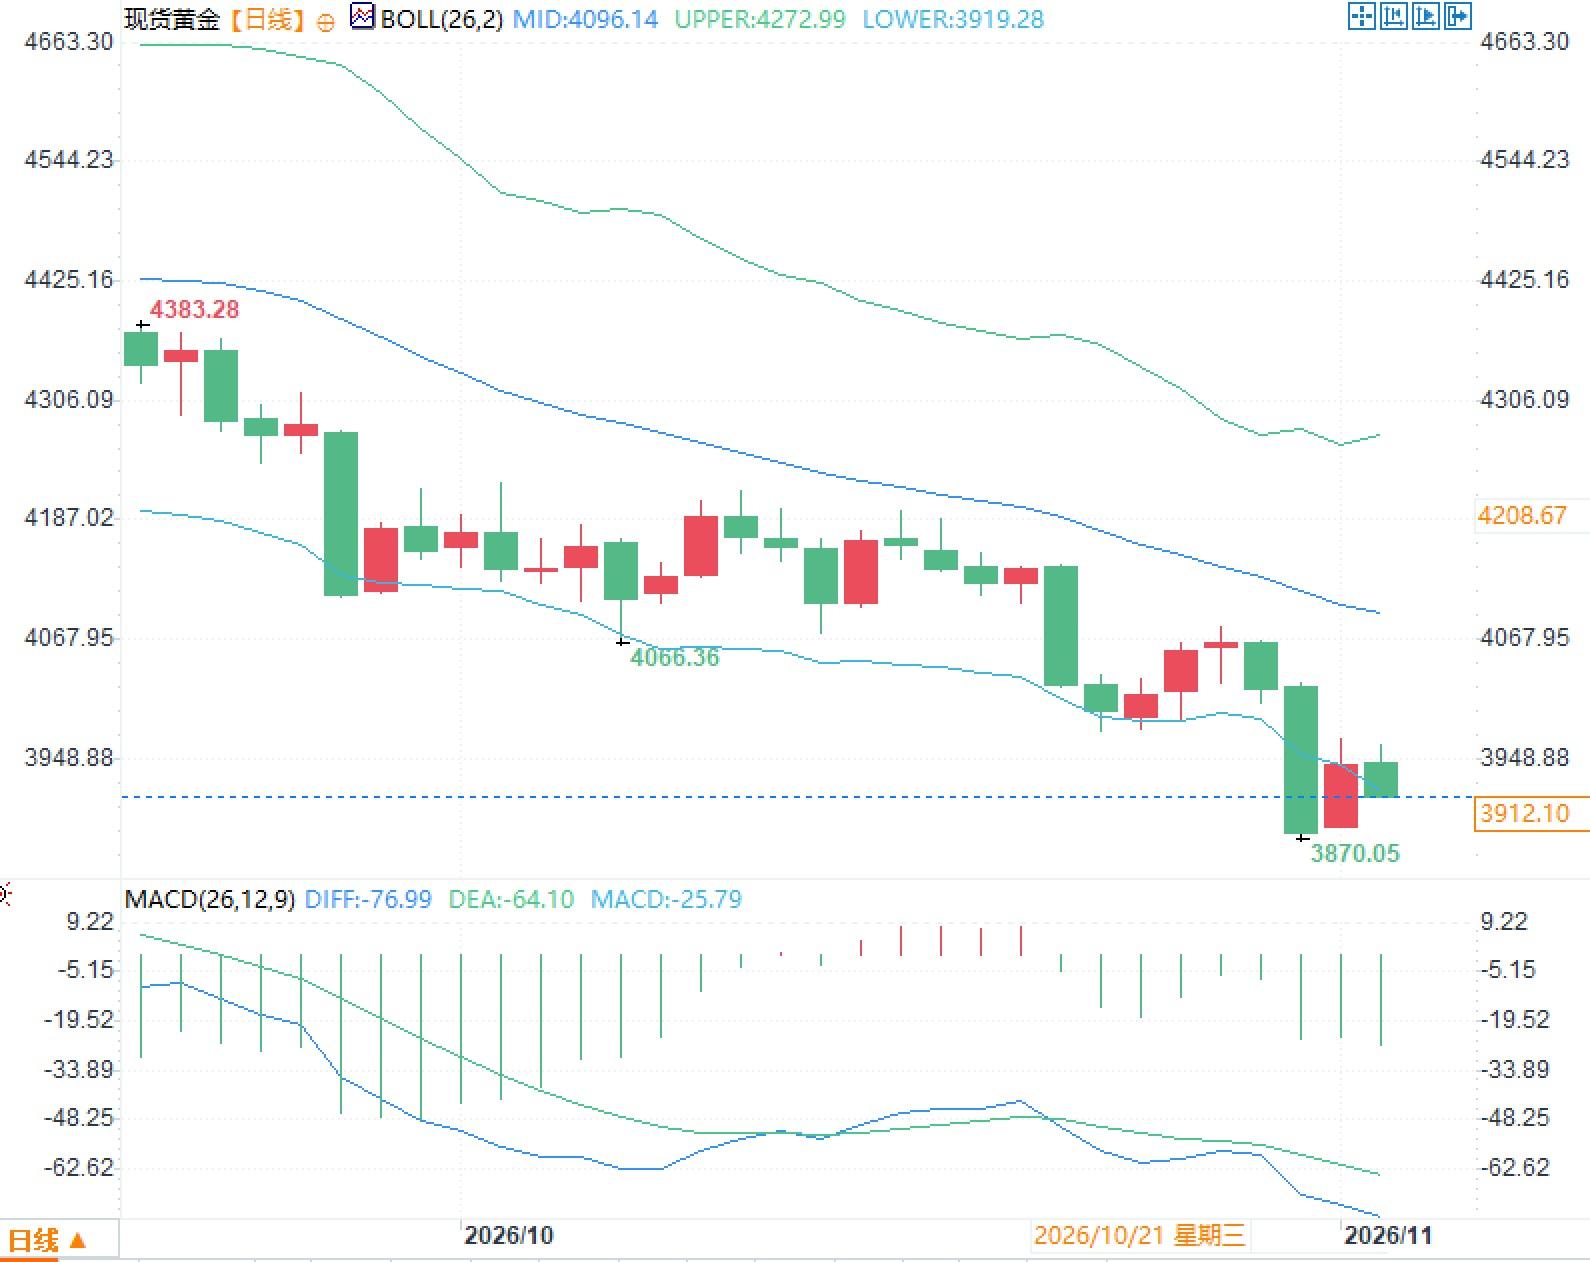
From a daily chart perspective, spot gold prices are trading within the Bollinger Bands, with the middle band around $4096, the upper band at $4273, and the lower band at $3919. The current price is near the lower band. The MACD shows a DIFF of -76.99, a DEA of -64.10, and a MACD histogram of -25.79, indicating that the indicators are generally in negative territory and the histogram is green, reflecting relatively weak momentum recently. Combining fundamentals, the sustainability of official gold purchases and the record level of ETF holdings, along with interest rate expectations and energy price fluctuations, constitute the main variables in market pricing. Market participants are focusing on the potential impact of subsequent inflation data, the policy paths of major central banks, and geopolitical developments on real interest rates and the US dollar exchange rate. These factors will continue to influence the relative attractiveness of non-interest-bearing assets.
- Risk Warning and Disclaimer
- The market involves risk, and trading may not be suitable for all investors. This article is for reference only and does not constitute personal investment advice, nor does it take into account certain users’ specific investment objectives, financial situation, or other needs. Any investment decisions made based on this information are at your own risk.

