












Analysis of the Gold Association's Third Quarter Report and Analysis of the Gold Price Decline
2026-11-03 17:18:28
On Tuesday (November 3), during the Asian and European sessions, international gold prices surged before falling sharply by over 1%, after rising as much as 0.42% intraday. The decline in oil prices reduced market concerns about energy inflation, but the lack of substantial progress in US-Iran negotiations limited the positive impact of the oil price drop on gold. Meanwhile, US tech stocks retreated by 3% intraday due to the earnings report from star company Athropic. At the same time, the World Gold Council released its third-quarter gold report; let's take a closer look. 
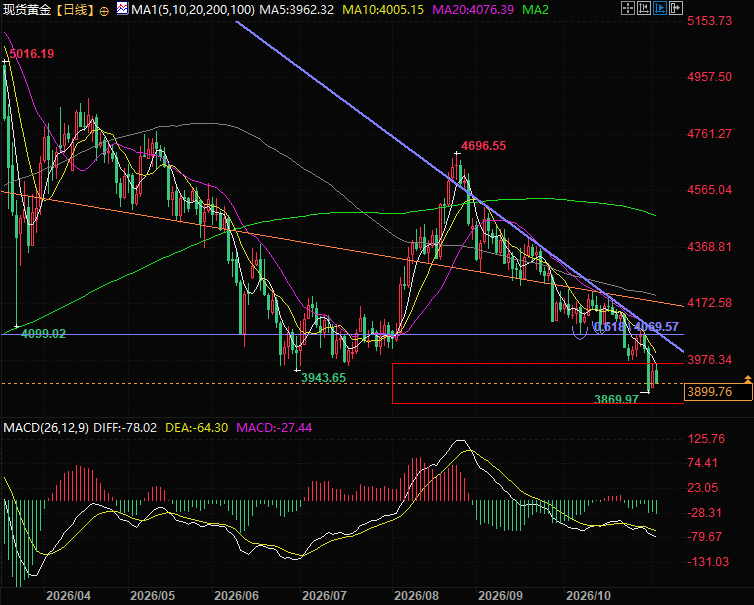 (Spot gold daily chart, source: EasyTrade) At 17:16 Beijing time, spot gold is currently trading at $3899 per ounce.
Profitability concerns emerge among leading AI companies, while tightening liquidity in risky assets puts downward pressure on gold prices.
Anthropic's prospectus and Q3 report show increased revenue but decreased profits: Q3 revenue surged, but the company shifted from operating profit in Q2 to operating loss, with computing power expenses surging sequentially. The company has secured nearly $895 billion in long-term, irrevocable computing power contracts, resulting in rigid costs. However, AI revenue relies on on-demand usage by enterprises and is more flexible. Market concerns that weakening demand could lead to rapidly expanding losses dragged down the AI sector. Subsequently, gold prices corrected due to liquidity issues stemming from the decline in US tech stocks.The Middle East maintains a pattern of simultaneous negotiations and fighting; geopolitical advantages are only temporary.
While oil prices have corrected somewhat due to the start of US-Iran mediation negotiations and inflation concerns have eased, the current situation is a classic example of a conflict unfolding while negotiations continue: the US allows Qatar to mediate while simultaneously carrying out limited strikes on Qeshm Island, which controls the Strait of Hormuz; Iran has also clearly reserved the option of a strong retaliation. The two sides have significant core differences, no ceasefire agreement has been reached, and internal divisions within the White House mean that the most likely short-term scenario is continued low-intensity friction, with a rapid and comprehensive ceasefire unlikely; however, the probability of a large-scale, all-out war and a complete blockade of the strait is currently low. The geopolitical risk premium has only been temporarily priced in and has not been completely cleared; therefore, the positive impact of the oil price decline on gold is merely impulsive and very limited, and the Middle East risk line could be reignited at any time.Gold Demand Trends: Interpretation of the Q3 2026 Report
On November 3, 2026, the World Gold Council released its latest "Gold Demand Trends" report. Data shows that global gold demand (including OTC transactions) in the third quarter of 2026 declined slightly by 1% year-on-year to 1,369 tons. However, year-to-date, total demand reached 3,881 tons, almost on par with the record high of the same period in 2025 (3,884 tons), while the demand value reached a record high of US$566 billion. Central Bank Gold Purchases Rebound Significantly In the third quarter, global central bank gold purchases jumped to 321 tons, far exceeding the normal levels of recent quarters, pushing year-to-date central bank gold purchases to 675 tons, a year-on-year increase of 6%. This strong performance indicates that central banks are continuing to increase their gold reserves, and the demand for gold remains robust. It also illustrates the central bank's strategy of buying gold as it falls in price for long-term investment, meaning that buying power increases when gold prices drop. Gold ETFs Rebound Strongly After experiencing outflows in the second quarter, gold ETFs reversed course strongly in the third quarter, with net inflows of 211 tons. Analysts believe that heightened investor concerns about fiscal sustainability and inflation prospects were the main driver of this return to gold ETFs. The average afternoon fixing price of the London Bullion Market Association (LBMA) in the third quarter was $4,262 per ounce, the third highest quarterly average on record, up 23% year-on-year. The changes in ETF activity also reflect this trend: these funds tend to buy on dips and chase rising prices, exhibiting a mindset very similar to retail investors, buying more as prices rise and selling more as prices fall. Gold Bar and Coin Investments Become More Cautious In contrast to the ETF boom, gold bar and coin investors were more cautious. Global demand for gold bars and coins in the third quarter was 268 tons, down 19% year-on-year. Investors are generally waiting for clearer price trend signals before making decisions. Jewelry Demand Under Pressure High gold prices continue to suppress jewelry consumption. Global gold jewelry demand fell to 313 tonnes in the third quarter, a 17% year-on-year decrease, marking the lowest level in this data series for the third quarter. However, due to high gold prices, the value of demand actually rose slightly by 2%, reaching $43 billion. Gold use in the technology sector bucked the trend with a slight increase. Gold consumption in the technology sector increased by 3% year-on-year in the third quarter, reaching 85 tonnes. Increased demand for gold from artificial intelligence-related manufacturing successfully offset the dampening effect of high gold prices, becoming a major bright spot in the technology sector. On the supply side, gold mine production increased by 3% year-on-year to 1,071 tonnes, a new high for the third quarter. However, total supply decreased slightly by 1%. Looking ahead, the report points out that: demand for gold ETFs, gold bars, and gold coins will remain resilient, but will be affected by multiple intersecting factors; after an unexpectedly strong third quarter, central bank gold purchases are expected to reach at least the same level as in 2025 for the whole year; jewelry consumption will continue to slow against the backdrop of persistently high gold prices; recycled gold supply remains insensitive to high gold prices; and gold mine production will be the only source of potential slight growth on the supply side.Summary and Technical Analysis:
The view remains unchanged: a turning point for gold prices requires a halt in the decline of US tech stocks, leading to a return of risk appetite and liquidity, as well as expectations of a resolution to the Middle East geopolitical crisis. This would alleviate energy inflation, giving global central banks a chance to ease monetary policy. Simultaneously, when gold prices begin to rebound, retail funds, such as those from ETFs, will act as an accelerator, quickly participating in the rebound. Reports from the Gold Association clearly show that central bank purchases cannot change the trend of gold prices. Gold prices are primarily driven by their own fundamentals, recently mainly US tech stocks and oil prices, and previously primarily by the US dollar. Retail funds will also contribute to the rise and fall of gold prices. Technically, gold prices are currently still in a descending three-method candlestick pattern, with moving averages in a bearish alignment. The more distant support is around 3600, and the near-term support is around 3828. (Spot gold daily chart, source: EasyTrade) At 17:16 Beijing time, spot gold is currently trading at $3899 per ounce.
- Risk Warning and Disclaimer
- The market involves risk, and trading may not be suitable for all investors. This article is for reference only and does not constitute personal investment advice, nor does it take into account certain users’ specific investment objectives, financial situation, or other needs. Any investment decisions made based on this information are at your own risk.