













Gold prices fell again, while sharp fluctuations in oil prices kept traders cautious.
2026-11-04 01:32:25
On Tuesday (November 3), during the US trading session, spot gold returned to its downward trend due to the continued impact of sharp fluctuations in oil prices. Spot gold traded around $3,933 during the session, down 0.31% on the day, but still above the intraday low of $3,895.  Unconfirmed reports earlier indicated that the US and Iran had made concessions on Iran's nuclear program and the unfreezing of funds, causing a brief dip in oil prices and a rebound in gold. However, oil prices subsequently recovered some of their losses. Earlier on Tuesday, reports of a US strike on Iran's Qeshm Island pushed oil prices higher. Since the conflict erupted at the end of February, the correlation between oil prices and interest rate expectations has been a core driver of gold prices, with gold often moving inversely to oil prices. Rising energy costs exacerbate inflationary pressures, prompting central banks, especially the Federal Reserve, to maintain high interest rates or further tighten monetary policy. The Fed raised rates by 25 basis points in September, paused rate hikes in October, and reiterated its commitment to price stability, leaving room for further rate increases. The CME FedWatch Tool shows a 75% probability of a rate hike in December. Uncertainty in the Middle East, volatile oil prices, and hawkish expectations for the Fed continue to support the US dollar—although the dollar has retreated slightly from recent highs, this adds another layer of downward pressure to gold. Better-than-expected US labor market data further benefited the dollar. September's JOLTS job openings rose to 7.523 million, higher than the previous month's 7.19 million and exceeding market expectations of 7.13 million. The US Dollar Index (DXY), which measures the dollar against six major currencies, is currently trading around 101.93. Against this backdrop, gold's rebound is very fragile, the outlook for US-Iran negotiations is uncertain, and oil prices are highly susceptible to significant volatility. Traders will face a busy week of US employment data: JOLTS job openings data will be released on Tuesday, followed by the non-farm payroll report on Friday. The market is also closely watching Tuesday's US midterm elections, the results of which could influence the dollar's trajectory and subsequently impact gold prices. Dollar Outlook: Depends on Midterm Election Results and Iranian Geopolitical Risks Norman Libke of Commerzbank stated that if the Republicans lose their majority in both the House and Senate, the dollar could face greater downward pressure, weakening the Trump administration's overall political support. Even if only control of the House changes, the dollar will still encounter some resistance, albeit to a relatively limited extent. Conversely, "if the Republicans retain control of both the House and Senate, it will support the dollar." Libke also emphasized that the subsequent developments after the midterm elections will also have a significant impact on the dollar. He specifically warned that if Trump escalates the conflict with Iran again and launches a new round of attacks, it will push up energy prices in the short term and change market risk appetite. In this environment of heightened risk aversion, "the dollar will benefit from its safe-haven currency attributes, just as it did in the early stages of the Iran conflict." (Technical Analysis )
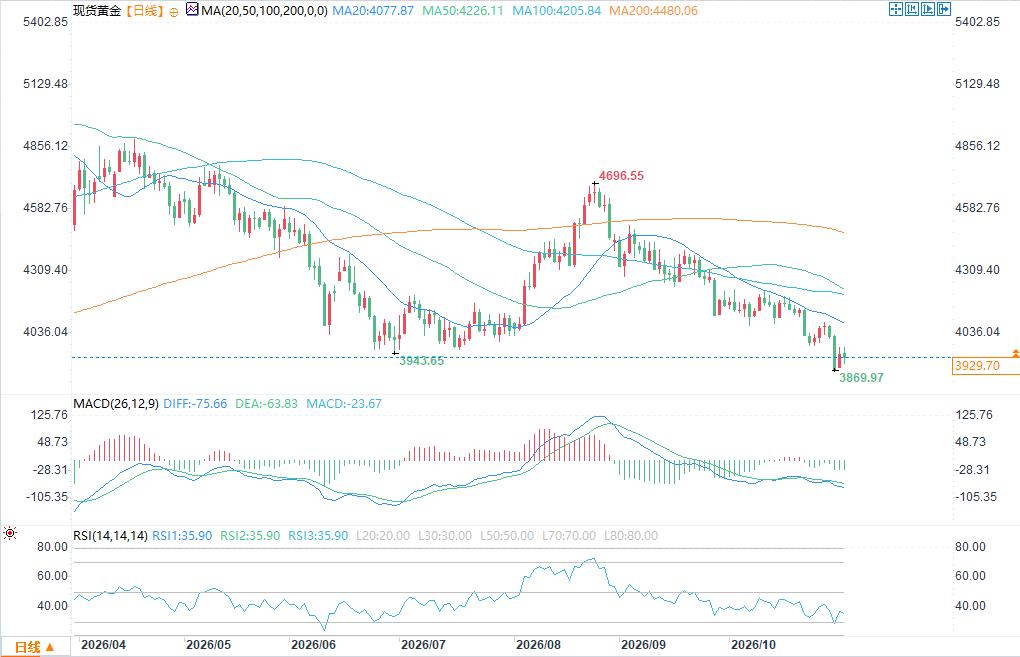 (Spot Gold Daily Chart Source: EasyForex) On the daily chart, spot gold is currently trading below all moving averages: MA20 (4077.87), MA50 (4226.11), MA100 (4205.84), and MA200 (4480.06). These moving averages, arranged from top to bottom, exert downward pressure on the gold price, indicating a bearish trend. The MACD indicator remains below the zero line, with the green bars persisting, suggesting continued bearish momentum without a clear reversal signal. The RSI (14) reading is 35.90, close to the oversold threshold of 30, indicating a weak market. Selling pressure has somewhat subsided, but a clear oversold stabilization signal has not yet been triggered. Resistance Levels : First Resistance: MA20 4077.87; Second Resistance: MA50/MA100 overlap zone 4205–4226; Further Structural Resistance: MA200 4480.06. Support Levels First Support: 3870, the year's low; a break below this support would open up further downside potential. The moving averages are clearly in a bearish trend, and indicators are also bearish; the RSI is nearing oversold territory, and a slight technical rebound in the short term cannot be ruled out, but this rebound should be viewed primarily as a correction. The moving averages above provide significant resistance, and only a firm hold above the 20-day moving average (MA20) would offer a chance to reverse the short-term weakness.
Unconfirmed reports earlier indicated that the US and Iran had made concessions on Iran's nuclear program and the unfreezing of funds, causing a brief dip in oil prices and a rebound in gold. However, oil prices subsequently recovered some of their losses. Earlier on Tuesday, reports of a US strike on Iran's Qeshm Island pushed oil prices higher. Since the conflict erupted at the end of February, the correlation between oil prices and interest rate expectations has been a core driver of gold prices, with gold often moving inversely to oil prices. Rising energy costs exacerbate inflationary pressures, prompting central banks, especially the Federal Reserve, to maintain high interest rates or further tighten monetary policy. The Fed raised rates by 25 basis points in September, paused rate hikes in October, and reiterated its commitment to price stability, leaving room for further rate increases. The CME FedWatch Tool shows a 75% probability of a rate hike in December. Uncertainty in the Middle East, volatile oil prices, and hawkish expectations for the Fed continue to support the US dollar—although the dollar has retreated slightly from recent highs, this adds another layer of downward pressure to gold. Better-than-expected US labor market data further benefited the dollar. September's JOLTS job openings rose to 7.523 million, higher than the previous month's 7.19 million and exceeding market expectations of 7.13 million. The US Dollar Index (DXY), which measures the dollar against six major currencies, is currently trading around 101.93. Against this backdrop, gold's rebound is very fragile, the outlook for US-Iran negotiations is uncertain, and oil prices are highly susceptible to significant volatility. Traders will face a busy week of US employment data: JOLTS job openings data will be released on Tuesday, followed by the non-farm payroll report on Friday. The market is also closely watching Tuesday's US midterm elections, the results of which could influence the dollar's trajectory and subsequently impact gold prices. Dollar Outlook: Depends on Midterm Election Results and Iranian Geopolitical Risks Norman Libke of Commerzbank stated that if the Republicans lose their majority in both the House and Senate, the dollar could face greater downward pressure, weakening the Trump administration's overall political support. Even if only control of the House changes, the dollar will still encounter some resistance, albeit to a relatively limited extent. Conversely, "if the Republicans retain control of both the House and Senate, it will support the dollar." Libke also emphasized that the subsequent developments after the midterm elections will also have a significant impact on the dollar. He specifically warned that if Trump escalates the conflict with Iran again and launches a new round of attacks, it will push up energy prices in the short term and change market risk appetite. In this environment of heightened risk aversion, "the dollar will benefit from its safe-haven currency attributes, just as it did in the early stages of the Iran conflict." (Technical Analysis ) (Spot Gold Daily Chart Source: EasyForex) On the daily chart, spot gold is currently trading below all moving averages: MA20 (4077.87), MA50 (4226.11), MA100 (4205.84), and MA200 (4480.06). These moving averages, arranged from top to bottom, exert downward pressure on the gold price, indicating a bearish trend. The MACD indicator remains below the zero line, with the green bars persisting, suggesting continued bearish momentum without a clear reversal signal. The RSI (14) reading is 35.90, close to the oversold threshold of 30, indicating a weak market. Selling pressure has somewhat subsided, but a clear oversold stabilization signal has not yet been triggered. Resistance Levels : First Resistance: MA20 4077.87; Second Resistance: MA50/MA100 overlap zone 4205–4226; Further Structural Resistance: MA200 4480.06. Support Levels First Support: 3870, the year's low; a break below this support would open up further downside potential. The moving averages are clearly in a bearish trend, and indicators are also bearish; the RSI is nearing oversold territory, and a slight technical rebound in the short term cannot be ruled out, but this rebound should be viewed primarily as a correction. The moving averages above provide significant resistance, and only a firm hold above the 20-day moving average (MA20) would offer a chance to reverse the short-term weakness.
- Risk Warning and Disclaimer
- The market involves risk, and trading may not be suitable for all investors. This article is for reference only and does not constitute personal investment advice, nor does it take into account certain users’ specific investment objectives, financial situation, or other needs. Any investment decisions made based on this information are at your own risk.

