













US Midterm Election Voting: Historically, gold prices have risen 8 times after 13 rounds of elections.
2026-11-04 02:18:26
Tuesday (November 3rd) marks the US midterm elections. Investors shouldn't be concerned about who wins; the most pressing question is: how does the price of gold typically react after a midterm election? Let's look at historical price records. From 1974 to 2022, there have been 13 midterm elections. The comparison is simple: compare the average monthly gold price in November of the election year with the average monthly price in November of the following year. We're looking at the average price over the entire month, not just short-term fluctuations on election day.  Of the 13 instances, gold prices were higher a year later in 8 of them; and fell in the remaining 5. The average increase was 14%, with a middle-level increase of 15%. The two most recent midterm elections that are more memorable saw gold prices rise by 20% in the year following 2018 and by 15% in the year following 2022.
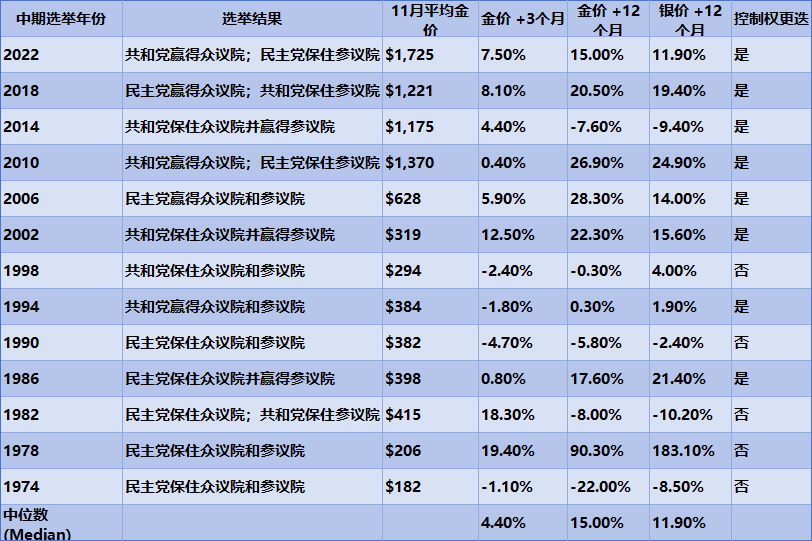 Historically, the range has been vastly different: in the worst years, prices fell by 22%, while in the best years, they surged by 90%. In 11 out of 13 instances, the fluctuations ranged from -8% to +28%. Looking at an average doesn't reveal the extent of the volatility. Two instances represent extremes. After the 1978 midterm elections, the Democrats retained control of both the House and Senate. Over the next 12 months, the average November gold price rose from approximately $206 to $392 per ounce, a 90% increase. This period coincided with the second oil crisis, the Iranian Revolution, the hostage crisis, and Volcker taking over the Federal Reserve in August of the same year. This upward trend didn't stop there; the Soviet invasion of Afghanistan further propelled gold prices to above $850 in January 1980. After the 1974 midterm elections, the Democrats again retained control of both houses of Congress. Gold prices had already surged after the decoupling of the dollar from gold, but after this election, the market reversed course and declined. Within a year, the average November price of gold fell from $182 to $142, a drop of 22%, ushering in a major bear market for gold in the era of floating exchange rates. The timeline of 2010 provides the clearest picture. On November 2nd, the Republicans won a majority in the House of Representatives, and the very next day, November 3rd, the Federal Reserve announced its second round of bond purchases, buying $600 billion in Treasury bonds. By November of the following year, the average monthly gold price was 27% higher than in the election month. It's important to understand that these major events simply happened to occur within the same timeframe; the election itself didn't drive up gold prices. The election was merely the starting point for our statistical analysis. Now let's look at silver. In the same 13 statistical analyses: 9 saw increases, 4 saw decreases. The average increase was 20%, with a median increase of 12%. This seemingly high average increase is mainly due to the surge in 1978: silver rose from $5.90 to $16.70, an increase of 183%. However, silver doesn't always outperform gold. In four instances of price declines, silver fell less than gold in three of them; and in 1998, silver rose while gold fell. Let's further divide them into two categories based on whether there was a change in congressional power. In 13 midterm elections, in eight of them, at least the Senate or House of Representatives saw a change in majority party. In this group, gold rose by an average of 15% a year later. In the other five elections, the ruling party remained unchanged, and gold rose by an average of 11%. The average increase in the two groups is not significantly different. The reason why the volatility in the group where power remained unchanged was so dramatic is entirely due to the 90% surge in 1978, a single sample that can change the perception. Here, we must address the practical limitations. There are only 13 historical data sets, a small sample size. In 8 of the 13 instances, prices rose, just slightly more often, like a coin toss landing heads slightly more frequently. From 1971 to the present, the price of gold has risen from $39 to over $4,000. The median increase in gold prices after midterm elections is 15%, higher than the median increase of 5.9% over a year if you randomly pick a month. However, the data is too limited to be considered a stable and reliable trading pattern. History can only tell us what kind of price movements have occurred in the past; it cannot prove that election results directly affect gold price fluctuations, nor can it predict how prices will move this time.
Of the 13 instances, gold prices were higher a year later in 8 of them; and fell in the remaining 5. The average increase was 14%, with a middle-level increase of 15%. The two most recent midterm elections that are more memorable saw gold prices rise by 20% in the year following 2018 and by 15% in the year following 2022. Historically, the range has been vastly different: in the worst years, prices fell by 22%, while in the best years, they surged by 90%. In 11 out of 13 instances, the fluctuations ranged from -8% to +28%. Looking at an average doesn't reveal the extent of the volatility. Two instances represent extremes. After the 1978 midterm elections, the Democrats retained control of both the House and Senate. Over the next 12 months, the average November gold price rose from approximately $206 to $392 per ounce, a 90% increase. This period coincided with the second oil crisis, the Iranian Revolution, the hostage crisis, and Volcker taking over the Federal Reserve in August of the same year. This upward trend didn't stop there; the Soviet invasion of Afghanistan further propelled gold prices to above $850 in January 1980. After the 1974 midterm elections, the Democrats again retained control of both houses of Congress. Gold prices had already surged after the decoupling of the dollar from gold, but after this election, the market reversed course and declined. Within a year, the average November price of gold fell from $182 to $142, a drop of 22%, ushering in a major bear market for gold in the era of floating exchange rates. The timeline of 2010 provides the clearest picture. On November 2nd, the Republicans won a majority in the House of Representatives, and the very next day, November 3rd, the Federal Reserve announced its second round of bond purchases, buying $600 billion in Treasury bonds. By November of the following year, the average monthly gold price was 27% higher than in the election month. It's important to understand that these major events simply happened to occur within the same timeframe; the election itself didn't drive up gold prices. The election was merely the starting point for our statistical analysis. Now let's look at silver. In the same 13 statistical analyses: 9 saw increases, 4 saw decreases. The average increase was 20%, with a median increase of 12%. This seemingly high average increase is mainly due to the surge in 1978: silver rose from $5.90 to $16.70, an increase of 183%. However, silver doesn't always outperform gold. In four instances of price declines, silver fell less than gold in three of them; and in 1998, silver rose while gold fell. Let's further divide them into two categories based on whether there was a change in congressional power. In 13 midterm elections, in eight of them, at least the Senate or House of Representatives saw a change in majority party. In this group, gold rose by an average of 15% a year later. In the other five elections, the ruling party remained unchanged, and gold rose by an average of 11%. The average increase in the two groups is not significantly different. The reason why the volatility in the group where power remained unchanged was so dramatic is entirely due to the 90% surge in 1978, a single sample that can change the perception. Here, we must address the practical limitations. There are only 13 historical data sets, a small sample size. In 8 of the 13 instances, prices rose, just slightly more often, like a coin toss landing heads slightly more frequently. From 1971 to the present, the price of gold has risen from $39 to over $4,000. The median increase in gold prices after midterm elections is 15%, higher than the median increase of 5.9% over a year if you randomly pick a month. However, the data is too limited to be considered a stable and reliable trading pattern. History can only tell us what kind of price movements have occurred in the past; it cannot prove that election results directly affect gold price fluctuations, nor can it predict how prices will move this time.- Risk Warning and Disclaimer
- The market involves risk, and trading may not be suitable for all investors. This article is for reference only and does not constitute personal investment advice, nor does it take into account certain users’ specific investment objectives, financial situation, or other needs. Any investment decisions made based on this information are at your own risk.

