













Gold breaks through the $4,000 mark as the US midterm elections shake the market.
2026-11-04 19:38:25
Gold buyers finally caught their breath – but the real test of this rebound is yet to come. Gold finally got a chance to breathe today, and the gains were quite substantial. Influenced by the news of the Democratic Party's landslide victory in the US midterm elections, the market is digesting the results, and gold has once again climbed back above the $4,000 mark.  Even more interestingly, US stock futures staged a remarkable reversal after their earlier sharp decline, with S&P 500 futures currently up nearly 1%. Meanwhile, the US dollar weakened against all currencies, although US Treasury yields haven't reacted strongly so far. So, what has reignited the enthusiasm of gold buyers? First, improved risk appetite has undoubtedly played a role. Previously weighed down by the tech stock sell-off, gold was shrouded in safe-haven sentiment and liquidation risk; this has now become a major positive factor. Second, a weaker dollar is also a logical and easily explained reason. Furthermore, the election results have increased expectations of a political gridlock in Washington. This, in turn, could limit Trump's fiscal expansion ambitions and, to some extent, anchor US Treasury yields. Regardless of which interpretation you prefer, the charts themselves are clearly conveying a wealth of signals.
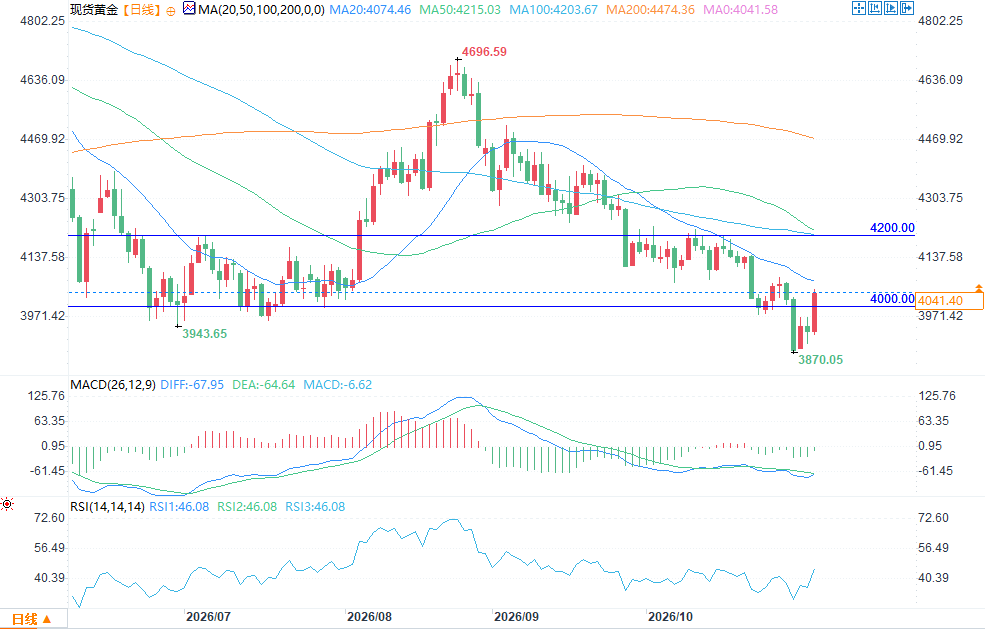 The short-term chart suggests that gold has finally recovered after reclaiming the psychological level of $4,000. More importantly, buyers also broke through a key hourly moving average, providing technical support for this rebound. That said, much work remains to be done. The next major resistance level is near $4,200, with the 100-day moving average lurking around that area. Until buyers are able to challenge this area, I remain cautious about calling a "pullback over." However, the weekly chart does look quite encouraging for gold.
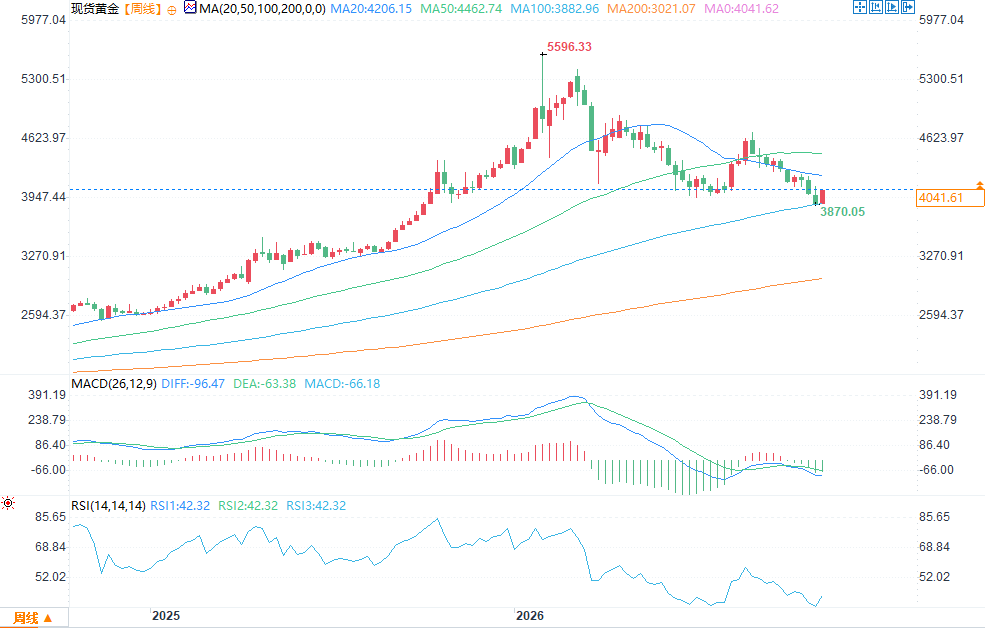 Despite the recent sell-off and a brief threat of a sharp drop below $4,000, gold buyers have successfully built a defensive line – particularly at the 100-week moving average (red line). This line is crucial, especially considering that gold prices haven't tested this key level for three years. Currently, gold buyers have undoubtedly bought themselves some extra breathing room. However, the real question is whether they can translate this rebound into a more convincing trend. The answer to this question largely lies in the charts, focusing on the key levels mentioned above. At 19:34 Beijing time, spot gold was trading at $4042.03 per ounce, up 2.85%.
Even more interestingly, US stock futures staged a remarkable reversal after their earlier sharp decline, with S&P 500 futures currently up nearly 1%. Meanwhile, the US dollar weakened against all currencies, although US Treasury yields haven't reacted strongly so far. So, what has reignited the enthusiasm of gold buyers? First, improved risk appetite has undoubtedly played a role. Previously weighed down by the tech stock sell-off, gold was shrouded in safe-haven sentiment and liquidation risk; this has now become a major positive factor. Second, a weaker dollar is also a logical and easily explained reason. Furthermore, the election results have increased expectations of a political gridlock in Washington. This, in turn, could limit Trump's fiscal expansion ambitions and, to some extent, anchor US Treasury yields. Regardless of which interpretation you prefer, the charts themselves are clearly conveying a wealth of signals. The short-term chart suggests that gold has finally recovered after reclaiming the psychological level of $4,000. More importantly, buyers also broke through a key hourly moving average, providing technical support for this rebound. That said, much work remains to be done. The next major resistance level is near $4,200, with the 100-day moving average lurking around that area. Until buyers are able to challenge this area, I remain cautious about calling a "pullback over." However, the weekly chart does look quite encouraging for gold. Despite the recent sell-off and a brief threat of a sharp drop below $4,000, gold buyers have successfully built a defensive line – particularly at the 100-week moving average (red line). This line is crucial, especially considering that gold prices haven't tested this key level for three years. Currently, gold buyers have undoubtedly bought themselves some extra breathing room. However, the real question is whether they can translate this rebound into a more convincing trend. The answer to this question largely lies in the charts, focusing on the key levels mentioned above. At 19:34 Beijing time, spot gold was trading at $4042.03 per ounce, up 2.85%.
- Risk Warning and Disclaimer
- The market involves risk, and trading may not be suitable for all investors. This article is for reference only and does not constitute personal investment advice, nor does it take into account certain users’ specific investment objectives, financial situation, or other needs. Any investment decisions made based on this information are at your own risk.