












With US Treasury yields falling, conditions are gradually forming for a breakout in silver prices.
2026-11-05 18:46:26
The emergence of a Democratic blue wave in the US midterm elections has significantly altered market expectations regarding the future of the Iran conflict. US Vice President Vance acknowledged that the conflict was a major contributing factor to the Republican Party's crushing defeat, a statement that fueled a sharp drop in oil prices on Wednesday, and market bets on further escalation of the conflict have clearly cooled. If Wednesday's market trend continues, it means that US Treasury yields and the US dollar have further room to decline, which will provide sustained positive support for precious metals.  Gold has broken its downtrend since early September, while silver is approaching its corresponding downtrend resistance level. Silver tends to amplify gold's intraday volatility, leading the market to focus on whether spot silver will become the next instrument to break out strongly. Is gold setting the direction for silver? This is particularly noteworthy. Gold has broken upwards from its downtrend; moreover, gold and silver are highly correlated, with silver's intraday price fluctuations typically being significantly larger than gold's. Based on daily return data: over the past 10 trading days, the correlation coefficient between silver and gold was as high as +0.99; over 20 periods it fell back to +0.91, and over 60 periods it was +0.89. In short, gold and silver prices have been moving almost in sync recently. Besides the highly consistent direction of price movements, the magnitude of volatility is also worth noting. Within the corresponding periods, the beta coefficients of silver relative to gold were 1.70, 1.79, and 1.52, respectively. In layman's terms: for every 1% fluctuation in gold in a single day, silver typically moves by an average of 1.5%–1.8%. Gold has broken out of its previous downtrend. Given the continued high positive correlation between gold and silver, and silver's greater volatility, once silver breaks out in a bullish direction, spot silver is likely to experience a larger price movement, making it worth close monitoring. Silver is caught between two conflicting factors . Earlier this week's analysis mentioned that the classic negative correlation between precious metals and US Treasury yields and the US dollar showed signs of reverting, which could have driven up gold and silver prices. However, a disruptive factor was the unusually strong positive correlation between gold and silver and tech stocks recently; if the AI trading rally weakens, its negative impact could outweigh the benefits of declining yields and a weaker dollar. The market changes in the past 24 hours have largely rewritten this logic. The sharp drop in crude oil prices, the decline in US Treasury yields, and the weakening dollar are macroeconomically beneficial to precious metals. The easing of expectations for a prolonged conflict in Iran is expected to improve overall market risk appetite, and silver, with its industrial attributes, may benefit additionally. Silver maintains a strong positive correlation with the global materials sector and Nasdaq 100 futures, with correlation coefficients reaching +0.86 and +0.71 respectively over the past 10 trading days; however, its correlation with the broader industrial and machinery sectors is relatively weak. This indicates that recent silver prices are driven more by the commodity sector and stock market sentiment than solely by expectations of industrial prosperity. However, given the sudden change in the macroeconomic environment overnight, it cannot be ruled out that if market expectations for economic growth improve, this could become a new positive factor supporting silver's rise. Silver faces a test for a bullish breakout .
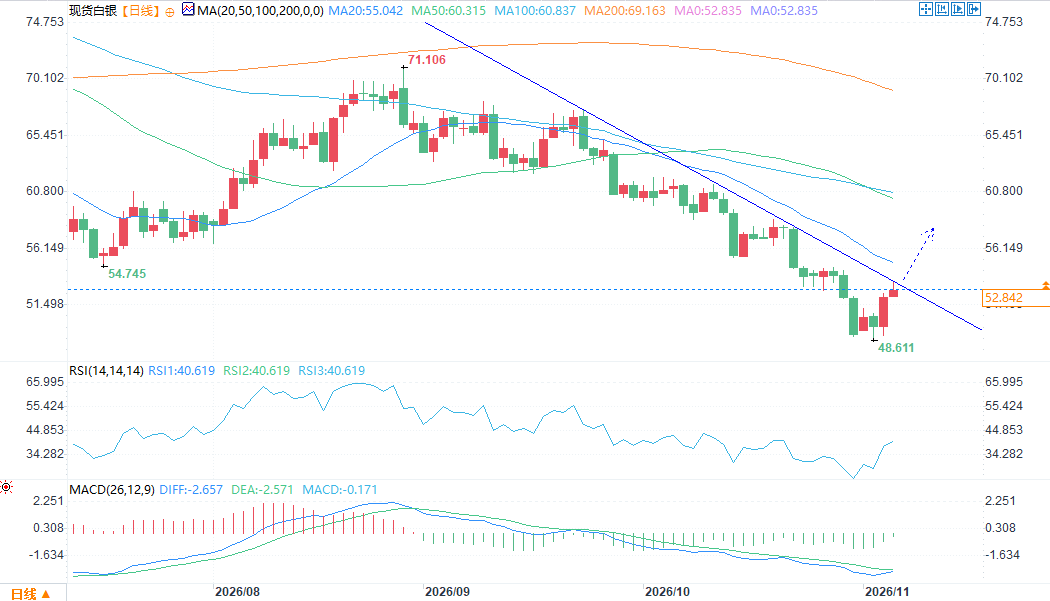 (Spot silver 4-hour chart source: FX678) Looking at the 4-hour silver chart: Over the past week, silver repeatedly tested the $48.86 support level but failed to break through, subsequently experiencing a strong rebound. The price has regained the short-term technical levels of $51.27 and $52.67, and is very close to the downtrend resistance line extending from the September high. This downtrend line is a key level to watch. If it breaks through and holds, a pullback for confirmation before further strengthening would be a good entry opportunity for bulls. Stop-loss orders can be placed tightly below this trend line to protect positions. Upside targets are $54.78, $55.40, $57, and even $58.50. If silver fails to replicate gold's bullish breakout, the first support levels to watch are $52.67 and $51.27. The 4-hour chart oscillators show that upward momentum is accumulating: the 14-period RSI continues to make new highs but has not yet entered the overbought zone; the MACD has been running above the signal line after completing the golden cross and has recently turned into the positive zone.
Gold has broken its downtrend since early September, while silver is approaching its corresponding downtrend resistance level. Silver tends to amplify gold's intraday volatility, leading the market to focus on whether spot silver will become the next instrument to break out strongly. Is gold setting the direction for silver? This is particularly noteworthy. Gold has broken upwards from its downtrend; moreover, gold and silver are highly correlated, with silver's intraday price fluctuations typically being significantly larger than gold's. Based on daily return data: over the past 10 trading days, the correlation coefficient between silver and gold was as high as +0.99; over 20 periods it fell back to +0.91, and over 60 periods it was +0.89. In short, gold and silver prices have been moving almost in sync recently. Besides the highly consistent direction of price movements, the magnitude of volatility is also worth noting. Within the corresponding periods, the beta coefficients of silver relative to gold were 1.70, 1.79, and 1.52, respectively. In layman's terms: for every 1% fluctuation in gold in a single day, silver typically moves by an average of 1.5%–1.8%. Gold has broken out of its previous downtrend. Given the continued high positive correlation between gold and silver, and silver's greater volatility, once silver breaks out in a bullish direction, spot silver is likely to experience a larger price movement, making it worth close monitoring. Silver is caught between two conflicting factors . Earlier this week's analysis mentioned that the classic negative correlation between precious metals and US Treasury yields and the US dollar showed signs of reverting, which could have driven up gold and silver prices. However, a disruptive factor was the unusually strong positive correlation between gold and silver and tech stocks recently; if the AI trading rally weakens, its negative impact could outweigh the benefits of declining yields and a weaker dollar. The market changes in the past 24 hours have largely rewritten this logic. The sharp drop in crude oil prices, the decline in US Treasury yields, and the weakening dollar are macroeconomically beneficial to precious metals. The easing of expectations for a prolonged conflict in Iran is expected to improve overall market risk appetite, and silver, with its industrial attributes, may benefit additionally. Silver maintains a strong positive correlation with the global materials sector and Nasdaq 100 futures, with correlation coefficients reaching +0.86 and +0.71 respectively over the past 10 trading days; however, its correlation with the broader industrial and machinery sectors is relatively weak. This indicates that recent silver prices are driven more by the commodity sector and stock market sentiment than solely by expectations of industrial prosperity. However, given the sudden change in the macroeconomic environment overnight, it cannot be ruled out that if market expectations for economic growth improve, this could become a new positive factor supporting silver's rise. Silver faces a test for a bullish breakout . (Spot silver 4-hour chart source: FX678) Looking at the 4-hour silver chart: Over the past week, silver repeatedly tested the $48.86 support level but failed to break through, subsequently experiencing a strong rebound. The price has regained the short-term technical levels of $51.27 and $52.67, and is very close to the downtrend resistance line extending from the September high. This downtrend line is a key level to watch. If it breaks through and holds, a pullback for confirmation before further strengthening would be a good entry opportunity for bulls. Stop-loss orders can be placed tightly below this trend line to protect positions. Upside targets are $54.78, $55.40, $57, and even $58.50. If silver fails to replicate gold's bullish breakout, the first support levels to watch are $52.67 and $51.27. The 4-hour chart oscillators show that upward momentum is accumulating: the 14-period RSI continues to make new highs but has not yet entered the overbought zone; the MACD has been running above the signal line after completing the golden cross and has recently turned into the positive zone.
- Risk Warning and Disclaimer
- The market involves risk, and trading may not be suitable for all investors. This article is for reference only and does not constitute personal investment advice, nor does it take into account certain users’ specific investment objectives, financial situation, or other needs. Any investment decisions made based on this information are at your own risk.