













Copper Price Outlook: Tight Supply in China Pushes Up Copper Prices Ahead of US CPI Release
2026-11-09 18:44:30
Copper prices rebounded to around $6.44 on Monday due to continued tightening of domestic supply. Copper inventories in Shanghai Futures Exchange warehouses fell nearly 24.1% last week to 33,848 tons, the lowest level since January 2024. Smelter maintenance has reduced domestic refined copper supply, prompting domestic buyers to turn to imports. Platts Energy data on Friday showed that China's copper import premium hit a record high of $220 per ton. High import costs have already led some domestic copper processing companies to reduce production.  Strong US jobs data last Friday supported a stronger dollar, putting downward pressure on copper prices. However, the dollar weakened on Monday, helping copper prices rebound strongly from their support level. The market is currently awaiting the release of the US Bureau of Labor Statistics' Consumer Price Index (CPI) data, which may determine the future direction of copper prices. If inflation data remains high, it will benefit the dollar index, continuing to pressure copper prices; if inflation data falls short of expectations, the dollar index may decline, thus providing support for copper prices. Copper Price Outlook – Resistance at $6.64, Support at $6 Looking at the daily chart for copper prices, after breaking below the 50-day simple moving average of $6.64, prices have continued to fall towards the 200-day simple moving average (approximately $6.30). Copper prices touched a low of $6.26 on November 6th, subsequently rebounding, but the rebound has remained weak. The price must rise back above the 50-day moving average of $6.64 to open up further upside potential; however, if it falls below $6.24, the price will likely drop further to around $6.
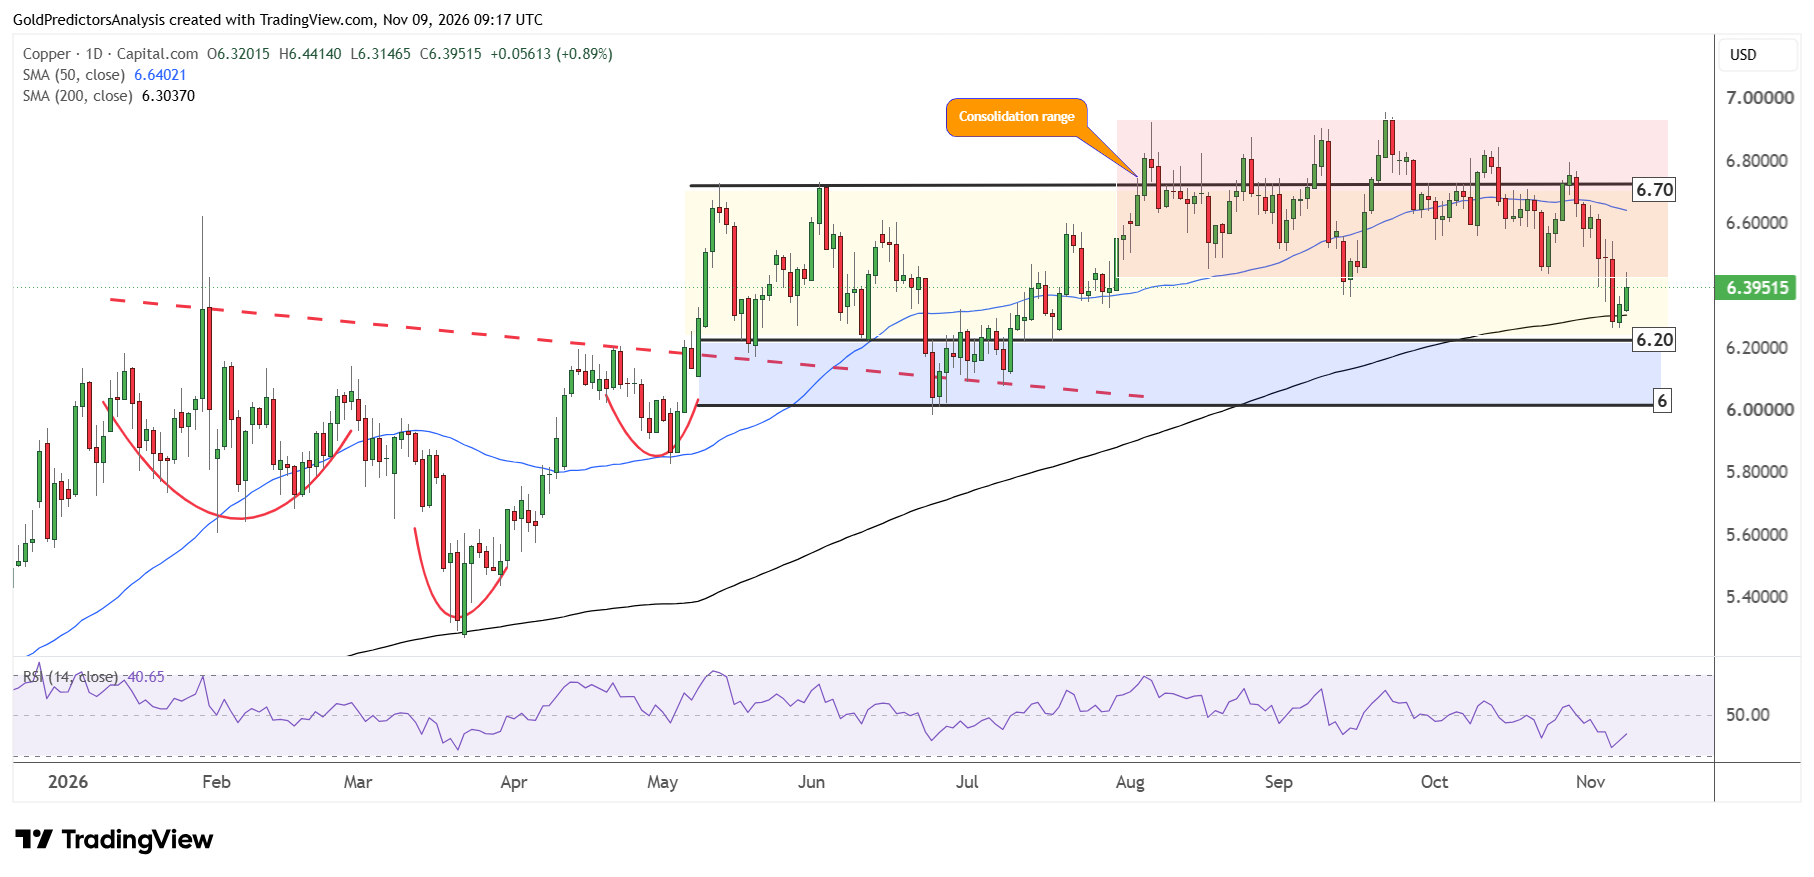
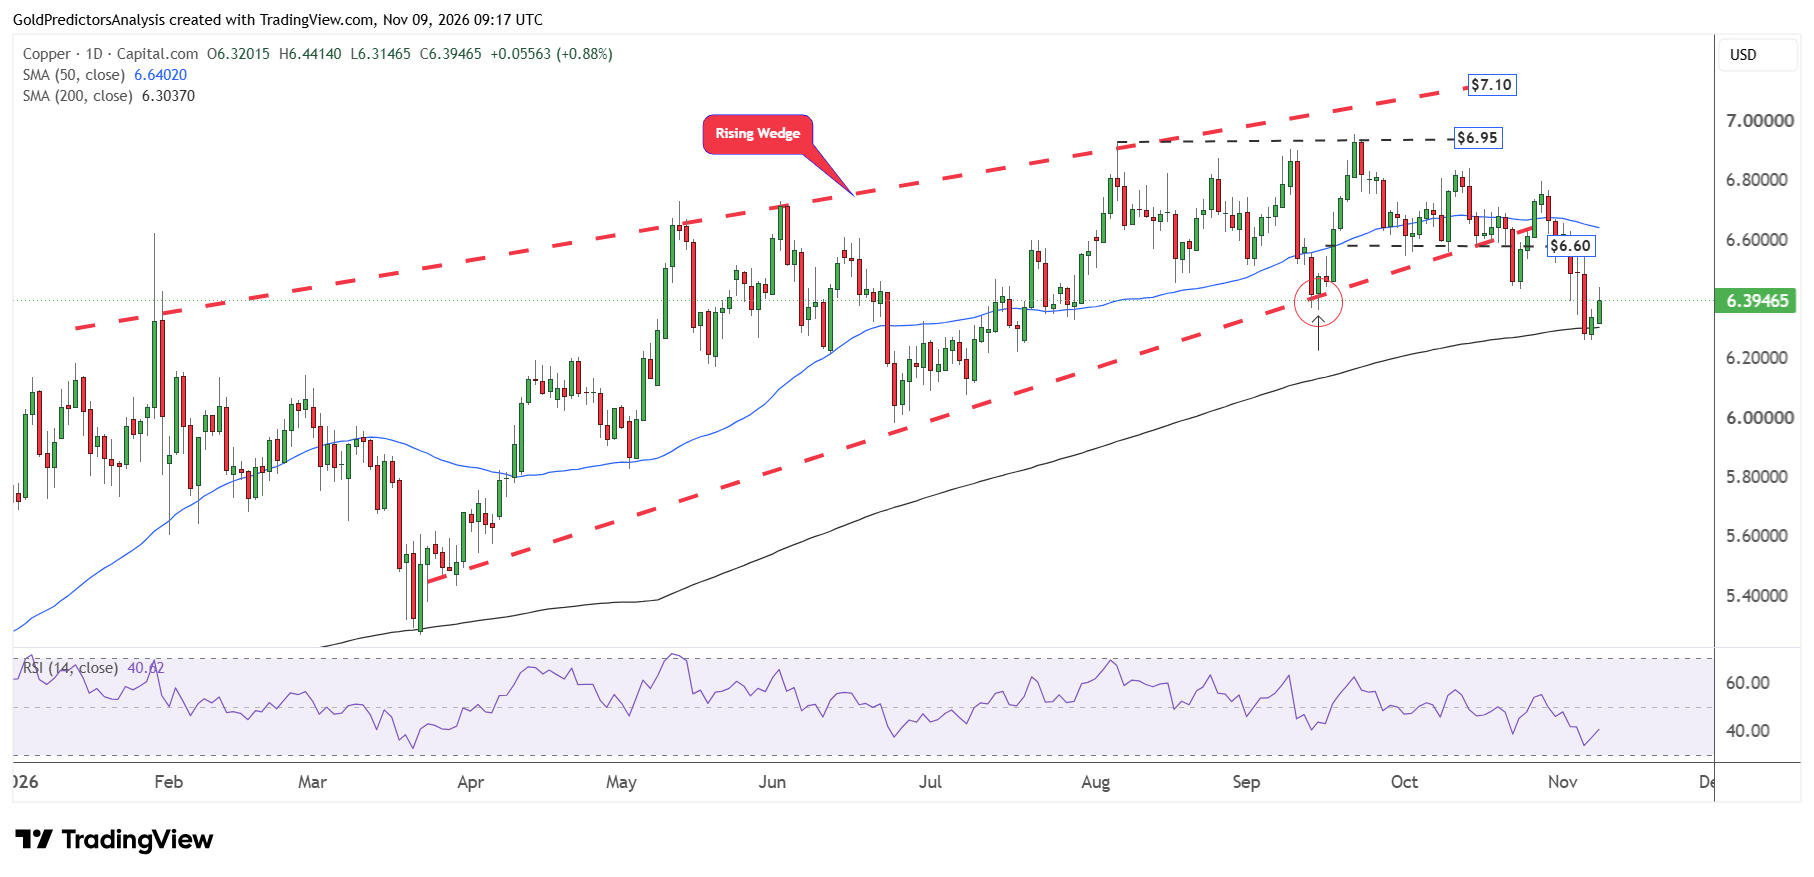 As shown in the chart below, copper prices are approaching the support area around $6.20, with the support zone marked in blue on the chart located between $6 and $6.20. The Relative Strength Index (RSI) remains below the midline, indicating a bearish short-term price trend; however, the indicator is expected to fluctuate within the 30-70 range throughout 2026.
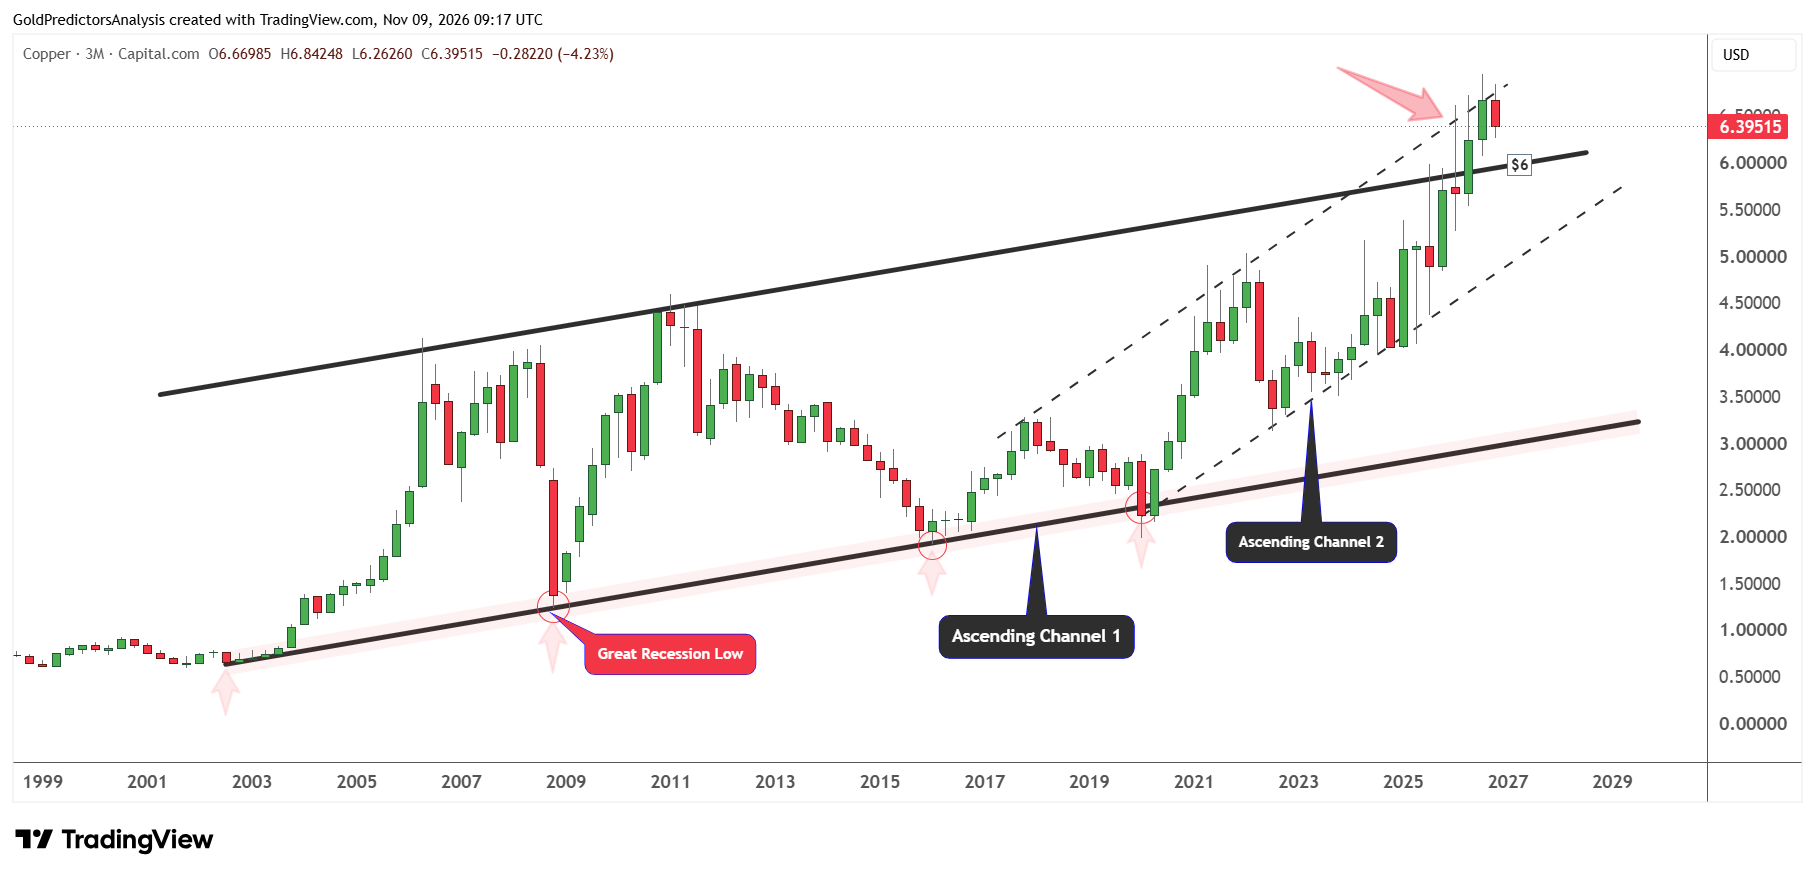
 The quarterly chart also highlights the critical significance of the current resistance level. Copper prices have been severely overbought for a long period and need a period of consolidation before starting a new round of gains. Prices are pulling back from the resistance level at the upper edge of the ascending channel, with $6 being a key support level for the copper market. The starting point of this ascending channel can be traced back to the price lows of 2002.
 The monthly chart shows that key support lies at $6, which is the midline of the ascending channel that began at the March 2020 low. A break below $6 would likely see copper prices further decline to $5.20, which corresponds to the ascending trendline extending from the May 2021 high.
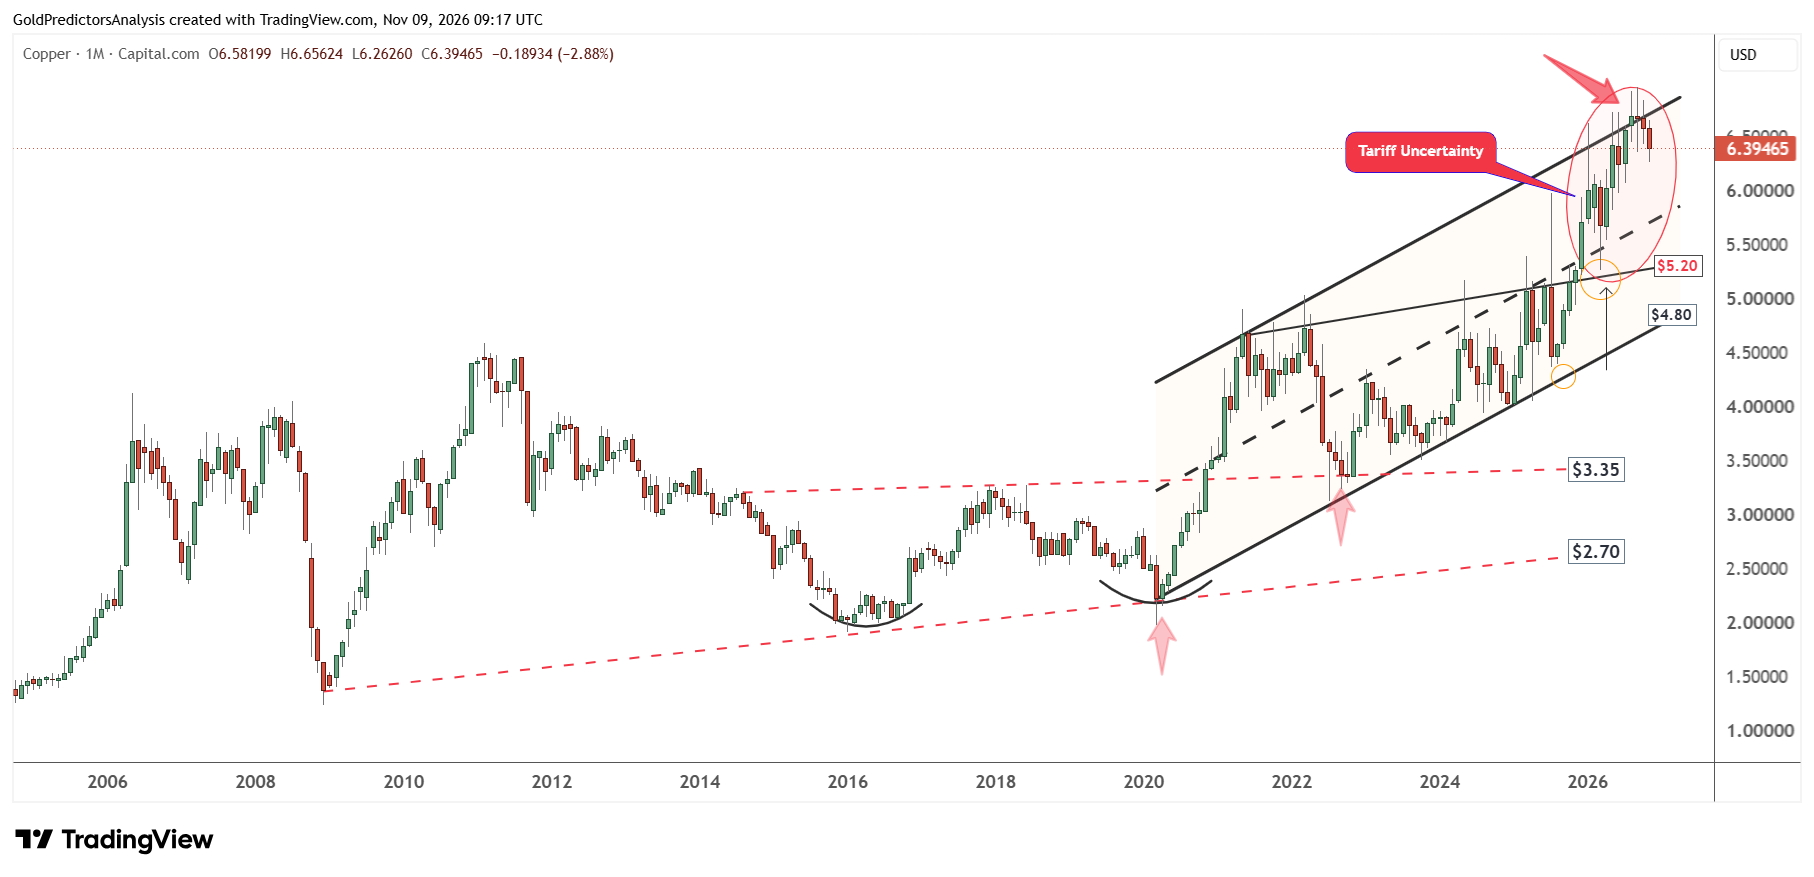 As long as copper prices remain above $5, the overall trend remains bullish. Benefiting from large-scale infrastructure demand in the artificial intelligence industry, this round of copper price correction may attract new buying. Why is a strong dollar suppressing copper prices? Charts show that copper prices typically move inversely to the US dollar index. In 2009, when the US dollar index surged, copper prices fell to lows before rebounding to around $4.50; similarly, in 2022, when the US dollar index rose, copper prices dipped to a low of $3.30 before surging to a record high. Since 2022, the US dollar index has generally been on a downward trend, while copper prices have continued to break historical highs. Market expectations of a Fed rate hike will boost the dollar, thus putting downward pressure on industrial and precious metals. Copper prices are currently retreating from a high of $6.95 towards the support zone, driven by the continued strength of the US dollar. Despite the correction, the long-term trend for copper remains positive, with long-term support at $5.20; a price pullback to $5.20 may attract a large number of new buyers. Key points to watch in the market outlook Tight supply in China has boosted copper prices, but for the upward trend to continue, a decisive break above the $6.64 resistance level is necessary. Weak inflation data and a weaker dollar could push copper prices above this resistance; conversely, strong inflation data and a stronger dollar would likely cause copper prices to fall back towards $6.24. A break below $6.24: the price will likely target $6; a break below $6: it will likely test the long-term support level of $5.20.
Strong US jobs data last Friday supported a stronger dollar, putting downward pressure on copper prices. However, the dollar weakened on Monday, helping copper prices rebound strongly from their support level. The market is currently awaiting the release of the US Bureau of Labor Statistics' Consumer Price Index (CPI) data, which may determine the future direction of copper prices. If inflation data remains high, it will benefit the dollar index, continuing to pressure copper prices; if inflation data falls short of expectations, the dollar index may decline, thus providing support for copper prices. Copper Price Outlook – Resistance at $6.64, Support at $6 Looking at the daily chart for copper prices, after breaking below the 50-day simple moving average of $6.64, prices have continued to fall towards the 200-day simple moving average (approximately $6.30). Copper prices touched a low of $6.26 on November 6th, subsequently rebounding, but the rebound has remained weak. The price must rise back above the 50-day moving average of $6.64 to open up further upside potential; however, if it falls below $6.24, the price will likely drop further to around $6. As shown in the chart below, copper prices are approaching the support area around $6.20, with the support zone marked in blue on the chart located between $6 and $6.20. The Relative Strength Index (RSI) remains below the midline, indicating a bearish short-term price trend; however, the indicator is expected to fluctuate within the 30-70 range throughout 2026. The quarterly chart also highlights the critical significance of the current resistance level. Copper prices have been severely overbought for a long period and need a period of consolidation before starting a new round of gains. Prices are pulling back from the resistance level at the upper edge of the ascending channel, with $6 being a key support level for the copper market. The starting point of this ascending channel can be traced back to the price lows of 2002. The monthly chart shows that key support lies at $6, which is the midline of the ascending channel that began at the March 2020 low. A break below $6 would likely see copper prices further decline to $5.20, which corresponds to the ascending trendline extending from the May 2021 high. As long as copper prices remain above $5, the overall trend remains bullish. Benefiting from large-scale infrastructure demand in the artificial intelligence industry, this round of copper price correction may attract new buying. Why is a strong dollar suppressing copper prices? Charts show that copper prices typically move inversely to the US dollar index. In 2009, when the US dollar index surged, copper prices fell to lows before rebounding to around $4.50; similarly, in 2022, when the US dollar index rose, copper prices dipped to a low of $3.30 before surging to a record high. Since 2022, the US dollar index has generally been on a downward trend, while copper prices have continued to break historical highs. Market expectations of a Fed rate hike will boost the dollar, thus putting downward pressure on industrial and precious metals. Copper prices are currently retreating from a high of $6.95 towards the support zone, driven by the continued strength of the US dollar. Despite the correction, the long-term trend for copper remains positive, with long-term support at $5.20; a price pullback to $5.20 may attract a large number of new buyers. Key points to watch in the market outlook Tight supply in China has boosted copper prices, but for the upward trend to continue, a decisive break above the $6.64 resistance level is necessary. Weak inflation data and a weaker dollar could push copper prices above this resistance; conversely, strong inflation data and a stronger dollar would likely cause copper prices to fall back towards $6.24. A break below $6.24: the price will likely target $6; a break below $6: it will likely test the long-term support level of $5.20.
- Risk Warning and Disclaimer
- The market involves risk, and trading may not be suitable for all investors. This article is for reference only and does not constitute personal investment advice, nor does it take into account certain users’ specific investment objectives, financial situation, or other needs. Any investment decisions made based on this information are at your own risk.

