












All transactions are essentially crude oil transactions.
2026-11-09 23:30:27
Since the conflict erupted on the night of February 27, all transactions have essentially been oil transactions. Whether you are trading forex, government bonds, the S&P 500 index, or precious metals, their rises and falls closely follow oil prices and the market's judgment on the direction of this conflict: the market is judging whether the situation will escalate or de-escalate.  This article will demonstrate that the correlation between various assets and crude oil has increased significantly. This is crucial at this juncture: after the midterm elections, it is hoped that the US government will realize it's time to withdraw from this conflict. I will first outline a decision-making framework, analyzing the conditions necessary for a substantial decline in oil prices. Then, I will show the extent to which the correlation between various assets and crude oil has risen since the attacks on the East-West oil pipeline. This current high correlation means that if the conflict subsides and oil prices fall, risk assets will generally strengthen, including the S&P 500, French government bonds, and precious metals; while safe-haven assets such as the US dollar and US Treasuries will weaken under pressure.
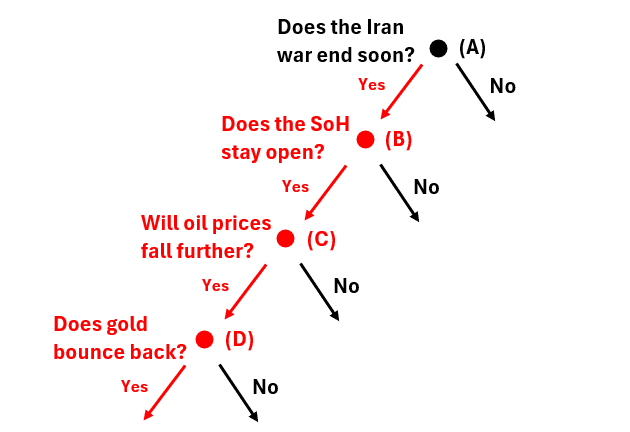 There are never simple answers to anything in life, and ending this conflict is by no means easy. The diagram above illustrates the entire process I've outlined. The first branch (A) of the decision-making framework depends on whether the United States can recognize reality and decide to end the conflict. I believe this possibility is increasing: opposition to the conflict within the Republican Party is growing louder, as evidenced by Vice President Vance's tweet that the conflict caused the Republicans to lose the midterm elections; at the same time, the effectiveness of the blockade measures is waning—Iran has realized that if it holds out until the new congressional inauguration in the new year, the situation will change. The second branch (B): Whether the Strait of Hormuz can remain open to navigation without the need for a large-scale US naval presence. In my view, the core issue is an exchange of interests. Iran's domestic economic situation is extremely poor, and the regime urgently needs funds; Saudi Arabia and other oil-exporting countries in the region are profiting handsomely from high oil prices and have ample funds to facilitate peace talks and appease Iran. The third branch (C): Whether oil prices will fall significantly after the above conditions are met. We already have a natural reference point: when the memorandum of understanding was signed in June of this year, oil prices plummeted. I firmly believe that if history repeats itself, oil prices will fall again. The fourth and final point (D): Can the strong correlation between assets and crude oil in the past few weeks continue? This is the focus of my next discussion.
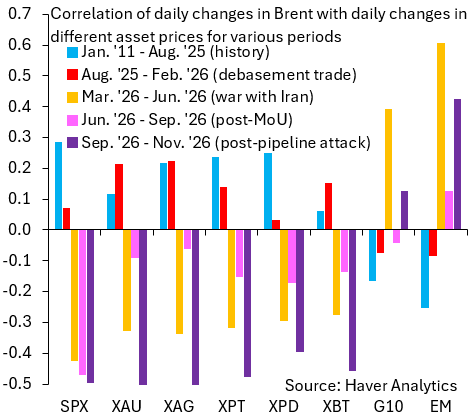 The chart above shows the daily price fluctuations of various assets and their correlation coefficients with the daily price fluctuations of Brent crude oil futures in the near month. The statistical targets include the S&P 500 (SPX), gold (XAU), silver (XAG), platinum (XPT), palladium (XPD), Bitcoin (XBT), as well as the US dollar against G10 currencies and the US dollar against emerging market currencies. A total of five statistical periods are divided: (1) Long-term benchmark period: from 2011 to mid-2025, that is, before the rise of the devaluation trading wave last year (blue bars); (2) The peak of the devaluation trading: from mid-2025 to early 2026 (red bars); (3) The outbreak of the Iranian conflict until the signing of the memorandum of understanding in June (orange bars); (4) The ceasefire period after the memorandum was reached, which was completely broken after the attack on the east-west oil pipeline on September 10 (pink bars); (5) The period since the pipeline attack, during which Brent oil prices have rebounded to the highs of March and April (purple bars). The following analysis will focus on the latest time window, specifically the correlation corresponding to the purple bars. In the most recent period—the two months following the pipeline attack—the S&P 500, gold and other precious metals, and crude oil showed a significant negative correlation. This high correlation was somewhat unexpected. Logically, many retail investors who entered the market after the gold price surge in 2025 should have gradually exited, but this has clearly not been the case. Even if the correlation weakens subsequently, there is still reason to believe that a decline in oil prices will drive these risk assets upward.
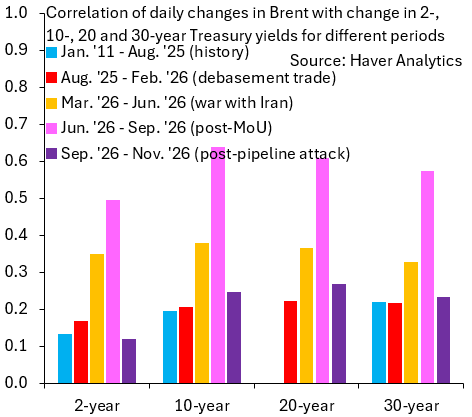 The next chart uses the same method to analyze the correlation between the daily changes in 2-year, 10-year, 20-year, and 30-year US Treasury yields and oil prices. Interestingly, during this phase of escalation, the correlation between US Treasury yields and oil prices actually decreased. As I mentioned in yesterday's live broadcast, this is because this period coincided with a sharp sell-off in French government bonds, leading to a flow of funds into US Treasuries and the US dollar seeking safe haven. Therefore, when oil prices fall, the decline in US Treasury yields is weaker than that of other asset classes. Safe-haven buying of US Treasuries subsides, and compared to high-risk government bonds like those from France and Italy, US Treasuries tend to underperform.
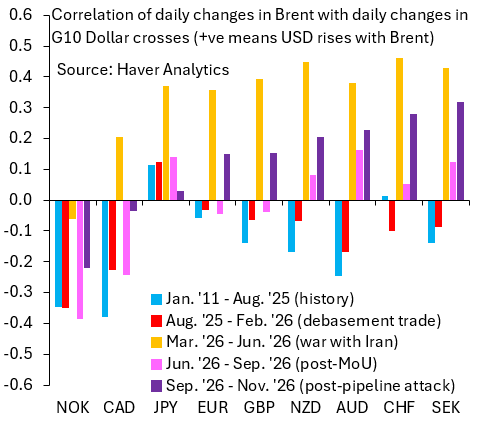 This final chart, continuing yesterday's analysis of the US dollar's performance after the midterm elections, shows the correlation between G10 currencies against the US dollar and crude oil. The currencies included are the Norwegian krone (NOK), Canadian dollar (CAD), Japanese yen (JPY), euro (EUR), British pound (GBP), New Zealand dollar (NZD), Australian dollar (AUD), Swiss franc (CHF), and Swedish krona (SEK). When oil prices rise, the US dollar appreciates the most against the Swedish krona (far right of the chart), followed by the Swiss franc and the Australian dollar. Conversely, when oil prices fall, the US dollar depreciates the fastest against these currencies. Conversely, the US dollar may strengthen against the Norwegian krone: the Norwegian krone is the G10 currency most closely tied to crude oil; falling oil prices will drag the krone down. In short: all current market movements depend on how much oil prices can fall. Since February 27th, the entire market has been a massive crude oil trading activity.
This article will demonstrate that the correlation between various assets and crude oil has increased significantly. This is crucial at this juncture: after the midterm elections, it is hoped that the US government will realize it's time to withdraw from this conflict. I will first outline a decision-making framework, analyzing the conditions necessary for a substantial decline in oil prices. Then, I will show the extent to which the correlation between various assets and crude oil has risen since the attacks on the East-West oil pipeline. This current high correlation means that if the conflict subsides and oil prices fall, risk assets will generally strengthen, including the S&P 500, French government bonds, and precious metals; while safe-haven assets such as the US dollar and US Treasuries will weaken under pressure. There are never simple answers to anything in life, and ending this conflict is by no means easy. The diagram above illustrates the entire process I've outlined. The first branch (A) of the decision-making framework depends on whether the United States can recognize reality and decide to end the conflict. I believe this possibility is increasing: opposition to the conflict within the Republican Party is growing louder, as evidenced by Vice President Vance's tweet that the conflict caused the Republicans to lose the midterm elections; at the same time, the effectiveness of the blockade measures is waning—Iran has realized that if it holds out until the new congressional inauguration in the new year, the situation will change. The second branch (B): Whether the Strait of Hormuz can remain open to navigation without the need for a large-scale US naval presence. In my view, the core issue is an exchange of interests. Iran's domestic economic situation is extremely poor, and the regime urgently needs funds; Saudi Arabia and other oil-exporting countries in the region are profiting handsomely from high oil prices and have ample funds to facilitate peace talks and appease Iran. The third branch (C): Whether oil prices will fall significantly after the above conditions are met. We already have a natural reference point: when the memorandum of understanding was signed in June of this year, oil prices plummeted. I firmly believe that if history repeats itself, oil prices will fall again. The fourth and final point (D): Can the strong correlation between assets and crude oil in the past few weeks continue? This is the focus of my next discussion. The chart above shows the daily price fluctuations of various assets and their correlation coefficients with the daily price fluctuations of Brent crude oil futures in the near month. The statistical targets include the S&P 500 (SPX), gold (XAU), silver (XAG), platinum (XPT), palladium (XPD), Bitcoin (XBT), as well as the US dollar against G10 currencies and the US dollar against emerging market currencies. A total of five statistical periods are divided: (1) Long-term benchmark period: from 2011 to mid-2025, that is, before the rise of the devaluation trading wave last year (blue bars); (2) The peak of the devaluation trading: from mid-2025 to early 2026 (red bars); (3) The outbreak of the Iranian conflict until the signing of the memorandum of understanding in June (orange bars); (4) The ceasefire period after the memorandum was reached, which was completely broken after the attack on the east-west oil pipeline on September 10 (pink bars); (5) The period since the pipeline attack, during which Brent oil prices have rebounded to the highs of March and April (purple bars). The following analysis will focus on the latest time window, specifically the correlation corresponding to the purple bars. In the most recent period—the two months following the pipeline attack—the S&P 500, gold and other precious metals, and crude oil showed a significant negative correlation. This high correlation was somewhat unexpected. Logically, many retail investors who entered the market after the gold price surge in 2025 should have gradually exited, but this has clearly not been the case. Even if the correlation weakens subsequently, there is still reason to believe that a decline in oil prices will drive these risk assets upward. The next chart uses the same method to analyze the correlation between the daily changes in 2-year, 10-year, 20-year, and 30-year US Treasury yields and oil prices. Interestingly, during this phase of escalation, the correlation between US Treasury yields and oil prices actually decreased. As I mentioned in yesterday's live broadcast, this is because this period coincided with a sharp sell-off in French government bonds, leading to a flow of funds into US Treasuries and the US dollar seeking safe haven. Therefore, when oil prices fall, the decline in US Treasury yields is weaker than that of other asset classes. Safe-haven buying of US Treasuries subsides, and compared to high-risk government bonds like those from France and Italy, US Treasuries tend to underperform. This final chart, continuing yesterday's analysis of the US dollar's performance after the midterm elections, shows the correlation between G10 currencies against the US dollar and crude oil. The currencies included are the Norwegian krone (NOK), Canadian dollar (CAD), Japanese yen (JPY), euro (EUR), British pound (GBP), New Zealand dollar (NZD), Australian dollar (AUD), Swiss franc (CHF), and Swedish krona (SEK). When oil prices rise, the US dollar appreciates the most against the Swedish krona (far right of the chart), followed by the Swiss franc and the Australian dollar. Conversely, when oil prices fall, the US dollar depreciates the fastest against these currencies. Conversely, the US dollar may strengthen against the Norwegian krone: the Norwegian krone is the G10 currency most closely tied to crude oil; falling oil prices will drag the krone down. In short: all current market movements depend on how much oil prices can fall. Since February 27th, the entire market has been a massive crude oil trading activity.
- Risk Warning and Disclaimer
- The market involves risk, and trading may not be suitable for all investors. This article is for reference only and does not constitute personal investment advice, nor does it take into account certain users’ specific investment objectives, financial situation, or other needs. Any investment decisions made based on this information are at your own risk.