













Gold prices struggled to stay above $4,000, pressured by a weaker dollar and boosted by expectations of a Federal Reserve rate hike.
2026-11-12 01:38:28
On Wednesday (November 11), spot gold gave back its earlier gains, dragged down by a generally stronger US dollar index. Earlier, higher-than-expected US inflation data, coupled with hawkish comments from Federal Reserve officials, fueled market expectations that the Fed would adopt a more aggressive interest rate hike path, causing gold to fall 2.67% in the previous trading session. Spot gold traded around $4003.50, retreating from its intraday high of $4066.  The US Consumer Price Index (CPI) rose 0.4% month-over-month in October, higher than the market expectation of 0.3%, but lower than the 0.6% increase in September. The core CPI, excluding food and energy, rose 0.3% month-over-month, unchanged from September, but higher than the market expectation of 0.2%. Economists at Commerzbank cautioned, "Although the price increase narrowed compared to September, inflation remains high." They pointed out, "As a key indicator of the core trend of inflation, core inflation remains high and is no longer showing a downward trend." The bank believes, "The strong resilience of the US economy, coupled with the ongoing conflict in the Middle East, means that inflation is unlikely to fall in the short term." The Fed's hawkish statements have led the market to price in a possible 50-basis-point rate hike. Before the CPI data was released, Fed Governor Christopher Waller stated that if the October core CPI reached "0.3% or higher," a 50-basis-point rate hike might be necessary in December. This inflation data just reached that threshold, and traders have already begun pricing in the possibility of a larger rate hike at the December policy meeting. Dallas Fed President Lori Logan, Philadelphia Fed President Anna Paulson, and other Fed officials also support further tightening of monetary policy; Fed Vice Chairman for Supervision Michelle Bowman emphasized the need to control inflation. According to the CME FedWatch Tool, the market has fully priced in a December rate hike: the probability of a 25 basis point hike is 88.5%, and the probability of a 50 basis point hike is 11.5%. Traders also expect more rate hikes next year, with the market already pricing in three additional 25 basis point hikes by mid-2027. The dollar and Treasury yields rose, with the market pricing in more rate hike expectations. The shift in rate hike expectations spurred buying of the dollar, leading to a significant sell-off of Treasury bonds, particularly short-term yields. On Tuesday, the yield on the highly policy-sensitive 2-year Treasury note rose by about 19 basis points; the benchmark 10-year Treasury yield rose by about 14 basis points, briefly regaining the 5% mark. The US bond market was closed on Wednesday due to the Veterans Day holiday. The US dollar index (DXY) rose 0.68% on the day, marking its second consecutive day of gains and approaching the year's high of 102.94 reached in October. A stronger dollar, persistently high US Treasury yields, and rising expectations of further tightening by the Federal Reserve are likely to continue to suppress gold prices. However, continued large-scale gold purchases by central banks and sustained inflows into gold ETFs may provide structural support for gold prices in the long term. Technical analysis: Gold prices are below key daily moving averages, indicating that bears are in control.
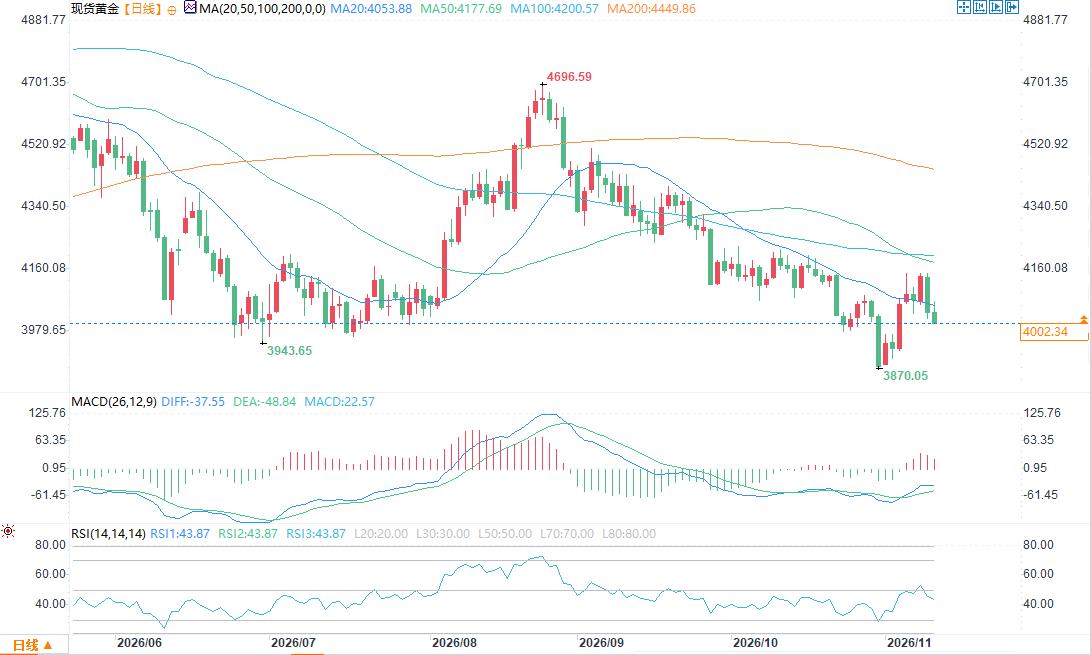 (Spot Gold Daily Chart Source: FX678) On the daily chart, spot gold is trading below the 21-day simple moving average ($4056), and the 50-day and 100-day simple moving averages, indicating an overall bearish bias. The Relative Strength Index (RSI) remains around 45, representing a balance between bullish and bearish momentum. While the MACD indicator remains in positive territory, the narrowing green bars suggest weakening bullish momentum. On the upside, the first resistance level is near the 21-day moving average at $4057, followed by resistance at the 50-day moving average at $4178 and the 100-day moving average at $4200. Previous highs near these levels will face strong selling pressure. On the downside, the psychological level of $4000 provides the first support, with the next support at the year's low of $3870.23. A break below this level would likely lead to further selling pressure.
The US Consumer Price Index (CPI) rose 0.4% month-over-month in October, higher than the market expectation of 0.3%, but lower than the 0.6% increase in September. The core CPI, excluding food and energy, rose 0.3% month-over-month, unchanged from September, but higher than the market expectation of 0.2%. Economists at Commerzbank cautioned, "Although the price increase narrowed compared to September, inflation remains high." They pointed out, "As a key indicator of the core trend of inflation, core inflation remains high and is no longer showing a downward trend." The bank believes, "The strong resilience of the US economy, coupled with the ongoing conflict in the Middle East, means that inflation is unlikely to fall in the short term." The Fed's hawkish statements have led the market to price in a possible 50-basis-point rate hike. Before the CPI data was released, Fed Governor Christopher Waller stated that if the October core CPI reached "0.3% or higher," a 50-basis-point rate hike might be necessary in December. This inflation data just reached that threshold, and traders have already begun pricing in the possibility of a larger rate hike at the December policy meeting. Dallas Fed President Lori Logan, Philadelphia Fed President Anna Paulson, and other Fed officials also support further tightening of monetary policy; Fed Vice Chairman for Supervision Michelle Bowman emphasized the need to control inflation. According to the CME FedWatch Tool, the market has fully priced in a December rate hike: the probability of a 25 basis point hike is 88.5%, and the probability of a 50 basis point hike is 11.5%. Traders also expect more rate hikes next year, with the market already pricing in three additional 25 basis point hikes by mid-2027. The dollar and Treasury yields rose, with the market pricing in more rate hike expectations. The shift in rate hike expectations spurred buying of the dollar, leading to a significant sell-off of Treasury bonds, particularly short-term yields. On Tuesday, the yield on the highly policy-sensitive 2-year Treasury note rose by about 19 basis points; the benchmark 10-year Treasury yield rose by about 14 basis points, briefly regaining the 5% mark. The US bond market was closed on Wednesday due to the Veterans Day holiday. The US dollar index (DXY) rose 0.68% on the day, marking its second consecutive day of gains and approaching the year's high of 102.94 reached in October. A stronger dollar, persistently high US Treasury yields, and rising expectations of further tightening by the Federal Reserve are likely to continue to suppress gold prices. However, continued large-scale gold purchases by central banks and sustained inflows into gold ETFs may provide structural support for gold prices in the long term. Technical analysis: Gold prices are below key daily moving averages, indicating that bears are in control. (Spot Gold Daily Chart Source: FX678) On the daily chart, spot gold is trading below the 21-day simple moving average ($4056), and the 50-day and 100-day simple moving averages, indicating an overall bearish bias. The Relative Strength Index (RSI) remains around 45, representing a balance between bullish and bearish momentum. While the MACD indicator remains in positive territory, the narrowing green bars suggest weakening bullish momentum. On the upside, the first resistance level is near the 21-day moving average at $4057, followed by resistance at the 50-day moving average at $4178 and the 100-day moving average at $4200. Previous highs near these levels will face strong selling pressure. On the downside, the psychological level of $4000 provides the first support, with the next support at the year's low of $3870.23. A break below this level would likely lead to further selling pressure.
- Risk Warning and Disclaimer
- The market involves risk, and trading may not be suitable for all investors. This article is for reference only and does not constitute personal investment advice, nor does it take into account certain users’ specific investment objectives, financial situation, or other needs. Any investment decisions made based on this information are at your own risk.