The Federal Reserve's increasingly hawkish stance poses a significant risk of a breakdown in gold prices.
2026-11-16 17:24:33
Gold prices continued to be pressured by the Federal Reserve's hawkish stance. Looking back, Fed official Waller delivered an extremely hawkish speech, even raising the possibility of a 50 basis point rate hike at the December meeting. Subsequently, the precious metal gave back all its gains since November. Waller's remarks triggered a hawkish repricing of Fed policy in the market, which was further exacerbated by higher-than-expected US CPI data. In addition, Trump stated on Truth Social that the US did not need a deal with Iran, a statement that pushed oil prices and the dollar higher in tandem.  Looking ahead, given the longer-than-expected duration of the US-Iran standoff and rising concerns about economic growth, interest rate hikes may put significant downward pressure on the stock market and long-term US Treasury yields. In the current environment, my assessment is that if Trump chooses to escalate the confrontation with Iran, rising inflation expectations coupled with a weakening economic outlook will create a stagflation environment, which will ultimately benefit gold. Conversely, if the situation eases and inflation concerns cool, the market will repric its expectations for further easing, which will also provide short-term support for gold. Currently, gold is indeed facing multiple strong negative factors; therefore, the above fundamental logic must be combined with technical signals to confirm a true reversal in market momentum. Gold Technical Analysis – Daily Chart
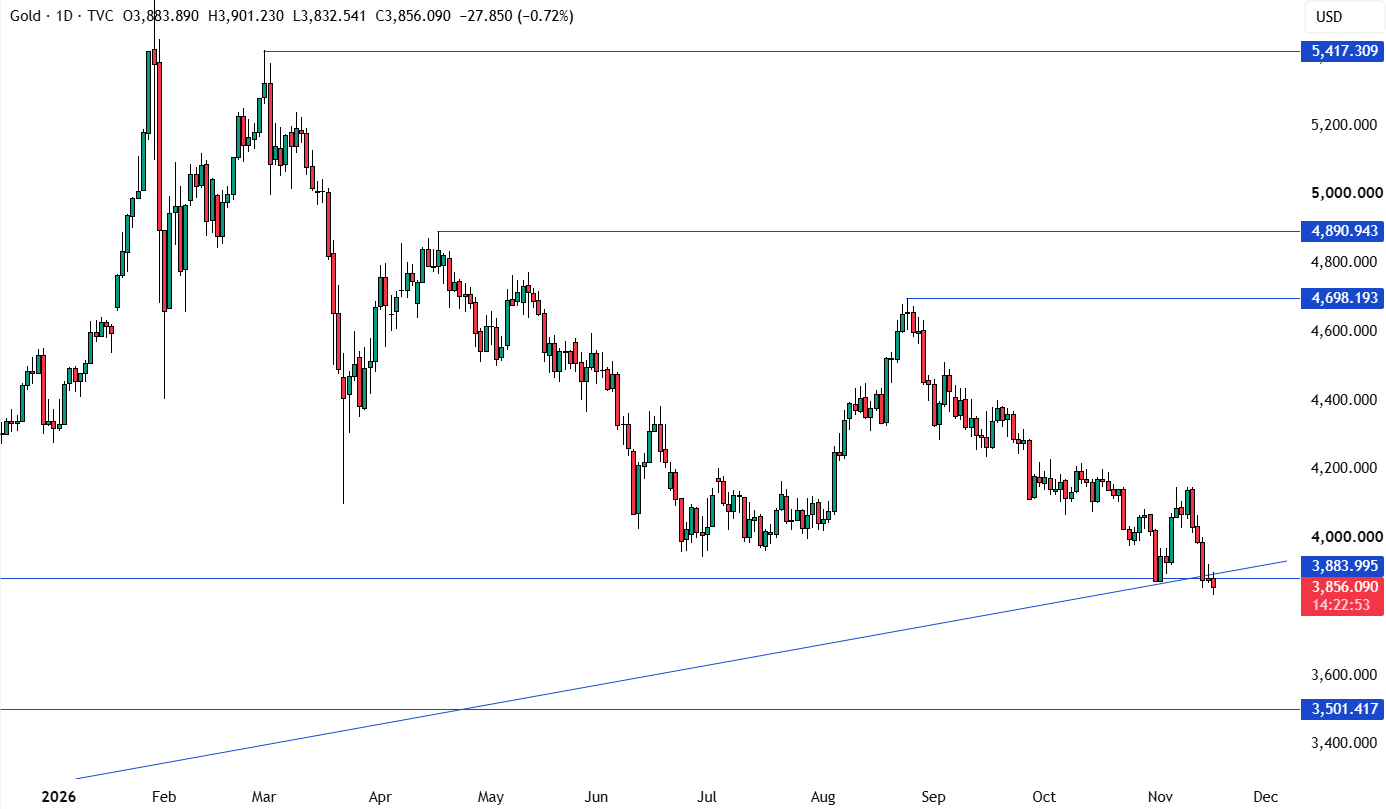 On the daily chart, spot gold CFDs have broken below the key support level around 3885, and also broken below the major upward trendline. Short sellers are expected to continue entering positions near this level; stop-loss orders should be placed above the broken trendline, targeting 3500. Conversely, bulls will need to see the price reclaim the broken trendline before making a significant entry, with a subsequent upside target of 4700. Gold Technical Analysis – 4-Hour Chart
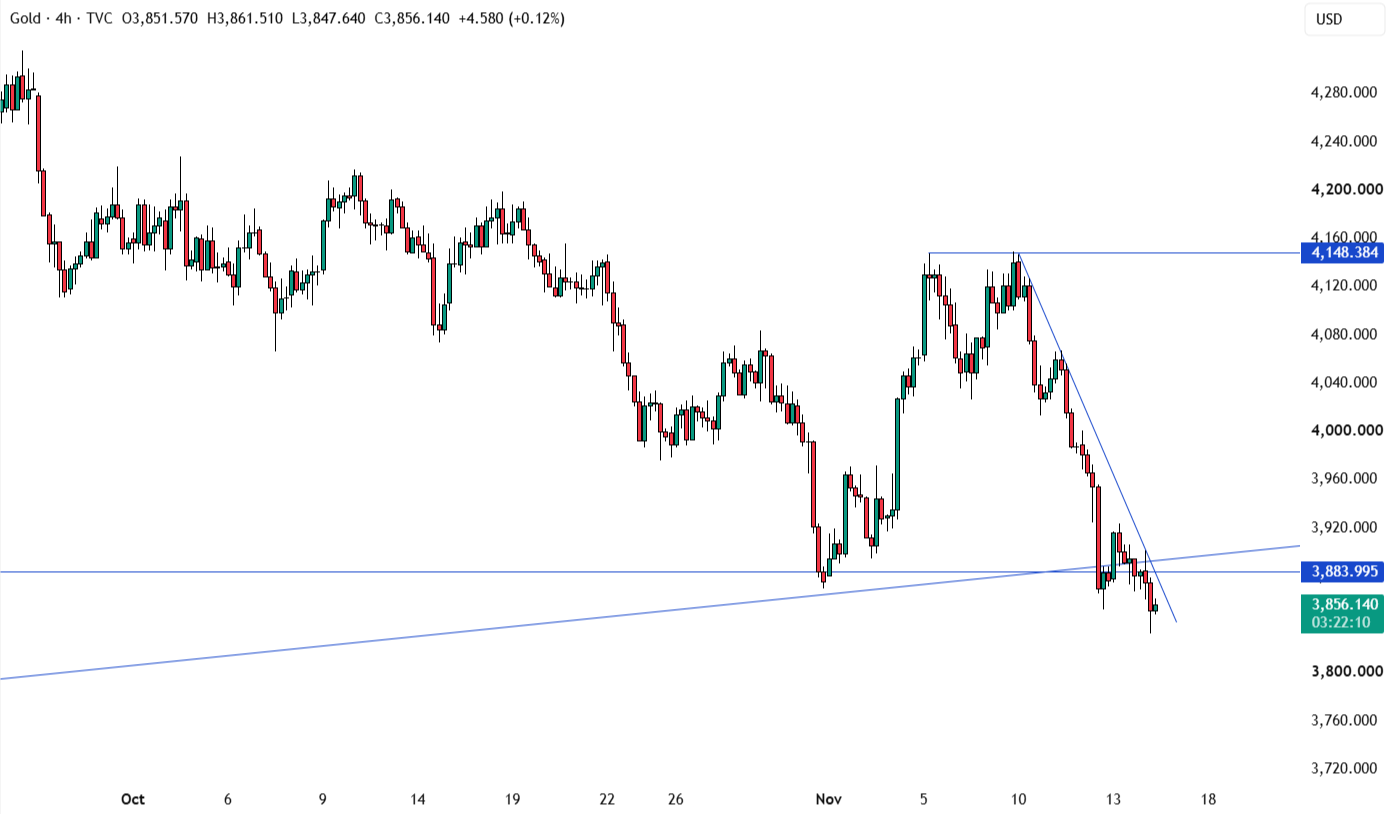 The 4-hour chart shows a downward trend line, defining the current bearish momentum. The bears are likely to continue applying pressure based on this trend line, with stop-loss orders placed above it, aiming for new lows. The bulls, on the other hand, need to break above the trend line to initiate long positions, with the first target at 4150, followed by 4700. Gold Technical Analysis – 1-Hour Chart
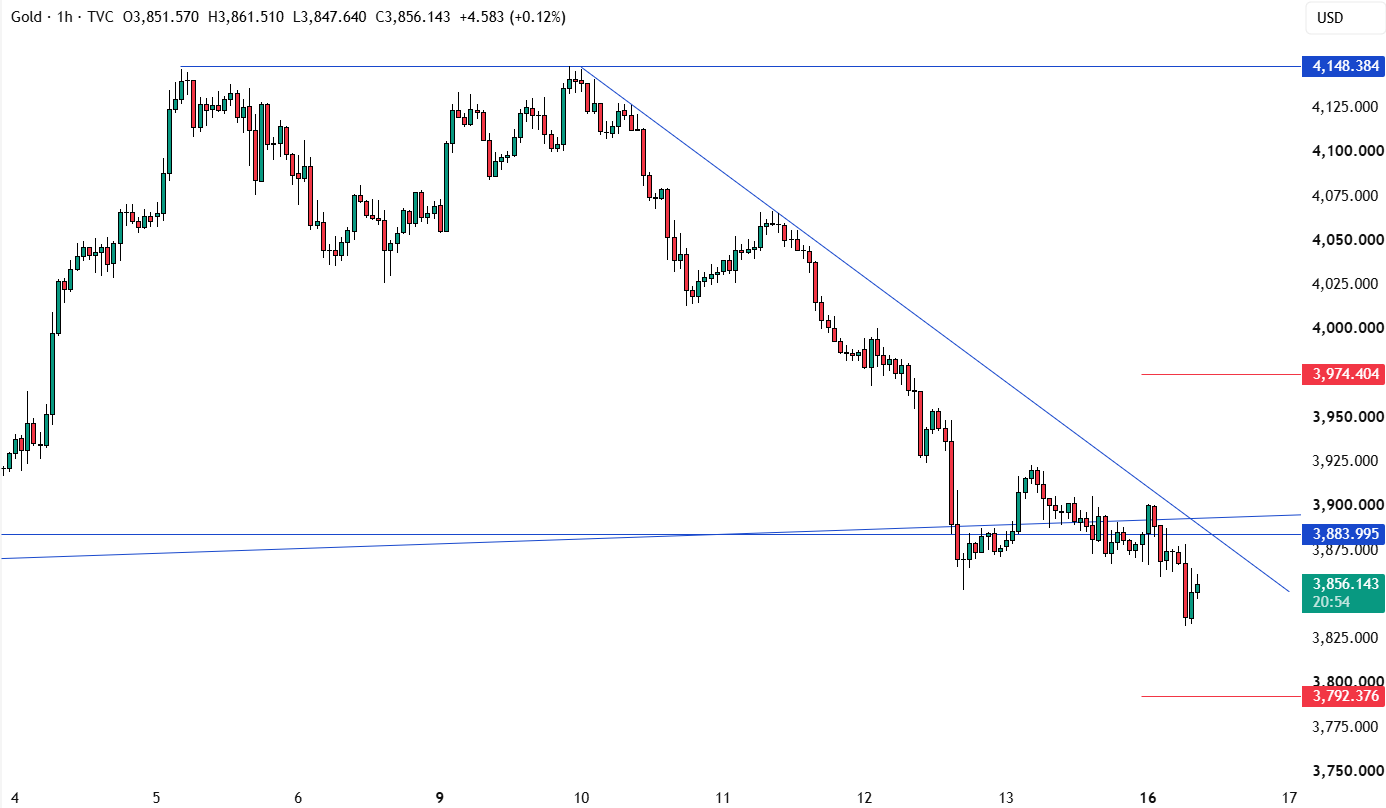 The hourly chart offers no further signals. Shorts have a better risk-reward ratio near the downtrend line; bulls must break above this trendline to open up new upside potential. The red line on the chart marks today's average daily trading range (ADR). Upcoming catalysts: Federal Reserve Chairman Warsh delivers a public speech; US retail sales data will be released tomorrow; the FOMC meeting minutes will be released on Wednesday; and US initial jobless claims data will be released on Thursday. Market focus will continue to revolve around speeches by Fed officials and the US-Iran standoff. At 17:20 Beijing time, spot gold was trading at $3862.74 per ounce, down 0.44%.
Looking ahead, given the longer-than-expected duration of the US-Iran standoff and rising concerns about economic growth, interest rate hikes may put significant downward pressure on the stock market and long-term US Treasury yields. In the current environment, my assessment is that if Trump chooses to escalate the confrontation with Iran, rising inflation expectations coupled with a weakening economic outlook will create a stagflation environment, which will ultimately benefit gold. Conversely, if the situation eases and inflation concerns cool, the market will repric its expectations for further easing, which will also provide short-term support for gold. Currently, gold is indeed facing multiple strong negative factors; therefore, the above fundamental logic must be combined with technical signals to confirm a true reversal in market momentum. Gold Technical Analysis – Daily Chart On the daily chart, spot gold CFDs have broken below the key support level around 3885, and also broken below the major upward trendline. Short sellers are expected to continue entering positions near this level; stop-loss orders should be placed above the broken trendline, targeting 3500. Conversely, bulls will need to see the price reclaim the broken trendline before making a significant entry, with a subsequent upside target of 4700. Gold Technical Analysis – 4-Hour Chart The 4-hour chart shows a downward trend line, defining the current bearish momentum. The bears are likely to continue applying pressure based on this trend line, with stop-loss orders placed above it, aiming for new lows. The bulls, on the other hand, need to break above the trend line to initiate long positions, with the first target at 4150, followed by 4700. Gold Technical Analysis – 1-Hour Chart The hourly chart offers no further signals. Shorts have a better risk-reward ratio near the downtrend line; bulls must break above this trendline to open up new upside potential. The red line on the chart marks today's average daily trading range (ADR). Upcoming catalysts: Federal Reserve Chairman Warsh delivers a public speech; US retail sales data will be released tomorrow; the FOMC meeting minutes will be released on Wednesday; and US initial jobless claims data will be released on Thursday. Market focus will continue to revolve around speeches by Fed officials and the US-Iran standoff. At 17:20 Beijing time, spot gold was trading at $3862.74 per ounce, down 0.44%.
- Risk Warning and Disclaimer
- The market involves risk, and trading may not be suitable for all investors. This article is for reference only and does not constitute personal investment advice, nor does it take into account certain users’ specific investment objectives, financial situation, or other needs. Any investment decisions made based on this information are at your own risk.