Gold prices hovered near 13-month lows, with hawkish expectations from the Federal Reserve limiting upside potential.
2026-11-17 00:42:30
On Monday (November 16), spot gold (XAU/USD) fell to $3,832, its lowest level since October 2025; during the American trading session, gold prices were largely flat. Spot gold was quoted at around $3,858 during the session, lower than the intraday high of $3,901. Gold prices struggled to rebound as the Federal Reserve's hawkish stance pushed up US Treasury yields and supported a stronger dollar. The US Dollar Index (DXY) was around 103.50, near its highest level since April 2025. The yield on the highly policy-sensitive 2-year US Treasury note was around 4.82%, while the benchmark 10-year US Treasury yield hovered around 5.11%. The dollar continued its upward trend as expectations of interest rate hikes intensified. Analysts at MUFG noted that "following a sharp rise last week, the dollar continued its strength at the beginning of this week," as investors are repricing the outlook for US monetary policy. Analysts noted, "Influenced by the third consecutive unexpected rise in the US core Consumer Price Index (CPI) in October and the Fed's shift to a hawkish stance, the market is beginning to price in a more aggressive tightening cycle from the Fed." Mitsubishi UFJ also stated, "Currently, US interest rate market pricing indicates an increased probability of consecutive Fed rate hikes in December, January, and March, which would push the effective federal funds rate to around 4.6%." DHF Capital CEO Bass Kuiman pointed out in a report, "A stronger dollar, primarily driven by increased expectations of a Fed rate hike, has become the main pressure on gold." He added that any dovish signals from Fed Chairman Kevin Warsh, this week's Fed meeting minutes, or US retail sales data could provide room for gold prices to stabilize, but hawkish comments or stronger spending would exacerbate current downward pressure. Kansas City Fed President Jeff Schmid stated on Sunday that inflation has reversed course, and current inflation levels remain "well above" the 2% target. Gold itself does not generate interest, and higher interest rates reduce the investment appeal of gold. The current market debate centers on whether the Federal Reserve will opt for a larger rate hike in December. Federal Reserve Governor Christopher Waller stated last week that a 50-basis-point rate hike would be reasonable if monthly core CPI inflation reached 0.3% or higher, and October's core CPI data precisely recorded 0.3%. Meanwhile, ongoing tensions between the US and Iran continue to push up oil prices, further exacerbating the risk of rising inflation. The Iranian Revolutionary Guard claimed that several oil tankers were attacked by mines and caught fire in the Strait of Hormuz. Reports indicate that Iranian drones attacked a US military base in Bahrain, and the USS Theodore Roosevelt aircraft carrier has also arrived in the area, raising market concerns about a renewed conflict. This week, there are few major US economic data releases; traders will focus on a series of speeches by Federal Reserve officials, with Fed Chairman Kevin Warsh speaking on Monday evening. The minutes of the Fed's October policy meeting will be released on Wednesday. On the data front, the market will pay attention to US retail sales data on Tuesday, initial jobless claims on Thursday, and the University of Michigan's November consumer confidence and inflation expectations survey on Friday. Technical Analysis: Weak momentum, bears in control. 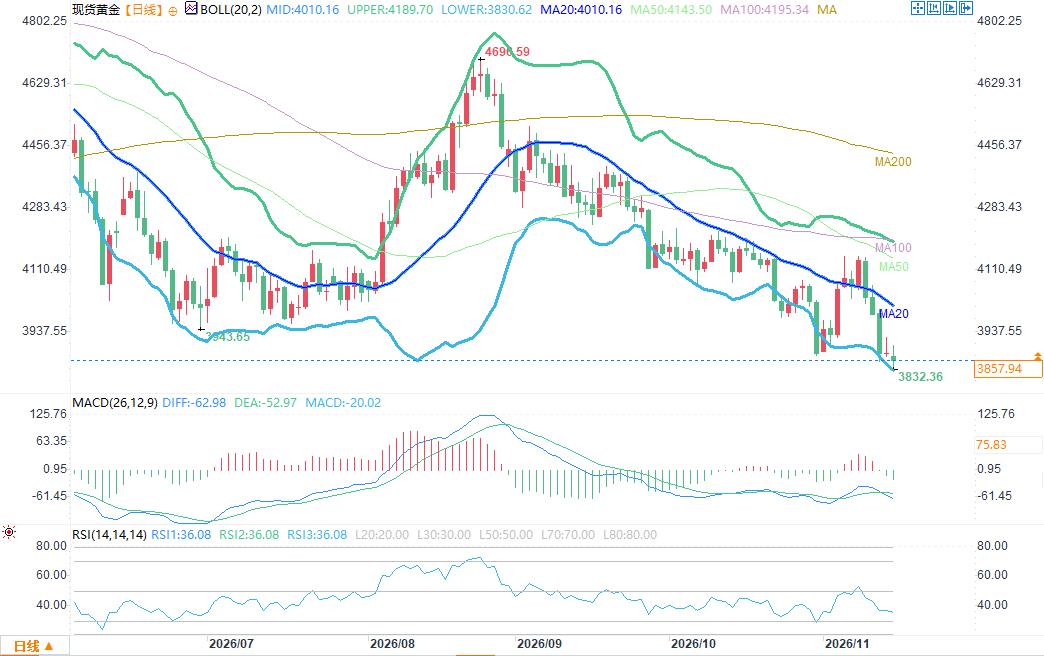 On the daily chart, spot gold (XAU/USD) is below the middle Bollinger Band (SMA) at $4010, maintaining a bearish short-term trend. While the price is currently holding above the lower Bollinger Band, the Relative Strength Index (RSI) has fallen to 37, and the Moving Average Convergence Divergence (MACD) is negative, further increasing downward pressure. Both indicators suggest that any attempt to rebound will likely encounter resistance nearby. Initial resistance is at the $3900 level, followed by the middle Bollinger Band at $4010. Stronger selling pressure is expected near the upper Bollinger Band at $4186, likely continuing the overall downward trend. The first support zone is around the lower Bollinger Band at approximately $3834, followed by the key level of $3800. A decisive break below these levels would trigger a deeper decline.
- Risk Warning and Disclaimer
- The market involves risk, and trading may not be suitable for all investors. This article is for reference only and does not constitute personal investment advice, nor does it take into account certain users’ specific investment objectives, financial situation, or other needs. Any investment decisions made based on this information are at your own risk.