Crude oil trading alert: Geopolitical tensions drive risk premiums higher; US crude oil remains volatile at low levels, with a potential oversold rebound?
2026-11-18 09:26:34
On Wednesday during Asian trading hours, US crude oil prices fell slightly, trading around $85.60. Geopolitical news was the direct catalyst for the recent price rebound. Bloomberg, citing US military officials, reported that US warplanes conducted a new round of self-defense strikes on Tuesday, attacking Iranian Revolutionary Guard positions on Qeshm Island. The US stated that this action was a response to Iran's continued attacks on US personnel and assets, and that Central Command would remain on high alert to continue protecting US targets in the region. The Strait of Hormuz is a vital global oil shipping route, and the anticipated escalation of conflict increased the risk of shipping disruptions. Investors temporarily traded geopolitical risk premiums, driving oil prices back from their lows.  However, the negative constraints on the supply and demand sides are very clear, limiting the height of this rebound. Last Friday, the IEA adjusted its oil market balance forecast, predicting that global crude oil supply will exceed demand by 1.7 million barrels per day in the fourth quarter of 2026, marking the first time since the outbreak of the conflict that supply has shifted from a shortage to a surplus. Key reasons include the recovery of supply in the Middle East and rising oil prices suppressing end-user demand. Analysts at Commerzbank interpret this as a cumulative increase of 5.3 million barrels per day since August, with supply significantly outpacing demand. On the demand side, the IEA forecasts a decline of 2.7 million barrels per day in crude oil demand for the whole of 2026, with a recovery to 2 million barrels per day only expected in 2027. Compared to OPEC+ production levels, the surplus in the fourth quarter is approximately 2 million barrels per day, and this surplus will expand to over 3 million barrels per day next year. This surplus is already reflected in inventory data; global crude oil inventories rose for the first time in four months in October, with floating storage and commercial inventories in the Gulf region increasing simultaneously. Furthermore, strategic reserves continue to be released, with 71 million barrels of crude oil and refined products expected to be released into the market by the end of February 2027. Of this, 37 million barrels will be released from the US and 33 million barrels from Europe, continuously putting supply pressure on long-term oil prices. The market will focus on Wednesday evening's EIA crude oil inventory data. A significant decrease in inventories indicates stronger-than-expected demand resilience, and oil prices are likely to continue their rebound; conversely, a continued increase in inventories will further confirm ample supply, and the geopolitical rebound is likely to fade quickly. On the daily chart, the overall bearish tone for WTI remains unchanged, with prices continuing to trade below the 100-day moving average and significantly below the 20-day Bollinger Band (middle Bollinger Band), maintaining a complete downward trend. The lower Bollinger Band provides short-term support, and the 14-period RSI reading is 36.0, just above the oversold threshold, indicating that bearish momentum is still being released, but the downward force is gradually entering the oversold zone, making repeated oversold corrections and rebounds likely. The first key resistance level is the 100-day moving average at $87.45, which is the core trend watershed of this decline; stronger resistance lies in the Bollinger Middle Band area at $92.55. Only a daily close above $87.45, and further above the Bollinger Middle Band, can alleviate the persistent bearish pressure and open up more room for correction. The upper Bollinger Band at $106.35 is a long-term bullish target, far from the current price and unlikely to be reached in the short term. The first support level is the lower Bollinger Band at $78.75, a crucial trend support level; a decisive break below this level would open up further downside potential. On the 4-hour chart, the short-term candlestick has rebounded from its lows, but the short-term moving averages have not yet formed a bullish alignment. This rebound is defined as a correction within a downtrend, not a trend reversal. Geopolitical news-driven price spikes tend to be short-lived and are likely to encounter resistance and fall back.
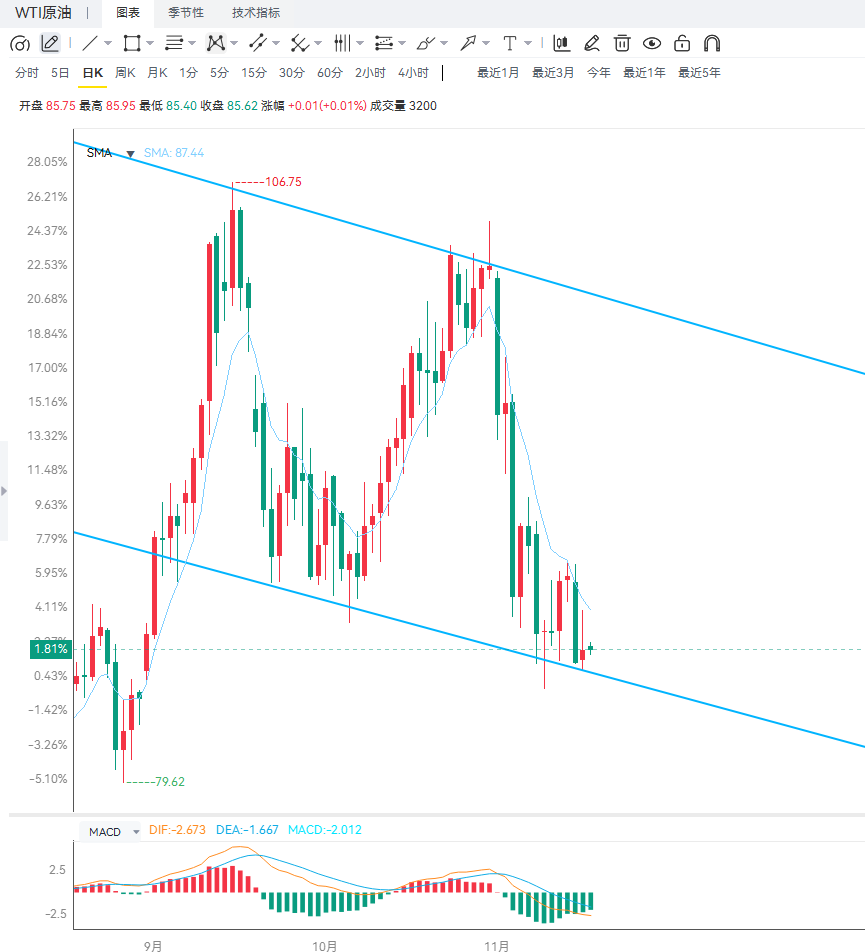 Editor's Summary: The current crude oil market exhibits a typical combination of "geopolitical impulsive support + supply and demand fundamentals suppression." The US military's strike on Iran targets boosted risk premiums, leading to a short-term rebound. However, medium- to long-term bearish factors such as the IEA's oversupply expectations, inventory accumulation, and continued reserve releases limit the upside potential. The daily chart shows a intact bearish structure, with indicators approaching oversold levels, suggesting the market will likely maintain a weak and volatile trend. Tonight's EIA inventory report is a key short-term variable; inventory reduction would be beneficial for a rebound, while inventory accumulation could easily lead to further weakness.
However, the negative constraints on the supply and demand sides are very clear, limiting the height of this rebound. Last Friday, the IEA adjusted its oil market balance forecast, predicting that global crude oil supply will exceed demand by 1.7 million barrels per day in the fourth quarter of 2026, marking the first time since the outbreak of the conflict that supply has shifted from a shortage to a surplus. Key reasons include the recovery of supply in the Middle East and rising oil prices suppressing end-user demand. Analysts at Commerzbank interpret this as a cumulative increase of 5.3 million barrels per day since August, with supply significantly outpacing demand. On the demand side, the IEA forecasts a decline of 2.7 million barrels per day in crude oil demand for the whole of 2026, with a recovery to 2 million barrels per day only expected in 2027. Compared to OPEC+ production levels, the surplus in the fourth quarter is approximately 2 million barrels per day, and this surplus will expand to over 3 million barrels per day next year. This surplus is already reflected in inventory data; global crude oil inventories rose for the first time in four months in October, with floating storage and commercial inventories in the Gulf region increasing simultaneously. Furthermore, strategic reserves continue to be released, with 71 million barrels of crude oil and refined products expected to be released into the market by the end of February 2027. Of this, 37 million barrels will be released from the US and 33 million barrels from Europe, continuously putting supply pressure on long-term oil prices. The market will focus on Wednesday evening's EIA crude oil inventory data. A significant decrease in inventories indicates stronger-than-expected demand resilience, and oil prices are likely to continue their rebound; conversely, a continued increase in inventories will further confirm ample supply, and the geopolitical rebound is likely to fade quickly. On the daily chart, the overall bearish tone for WTI remains unchanged, with prices continuing to trade below the 100-day moving average and significantly below the 20-day Bollinger Band (middle Bollinger Band), maintaining a complete downward trend. The lower Bollinger Band provides short-term support, and the 14-period RSI reading is 36.0, just above the oversold threshold, indicating that bearish momentum is still being released, but the downward force is gradually entering the oversold zone, making repeated oversold corrections and rebounds likely. The first key resistance level is the 100-day moving average at $87.45, which is the core trend watershed of this decline; stronger resistance lies in the Bollinger Middle Band area at $92.55. Only a daily close above $87.45, and further above the Bollinger Middle Band, can alleviate the persistent bearish pressure and open up more room for correction. The upper Bollinger Band at $106.35 is a long-term bullish target, far from the current price and unlikely to be reached in the short term. The first support level is the lower Bollinger Band at $78.75, a crucial trend support level; a decisive break below this level would open up further downside potential. On the 4-hour chart, the short-term candlestick has rebounded from its lows, but the short-term moving averages have not yet formed a bullish alignment. This rebound is defined as a correction within a downtrend, not a trend reversal. Geopolitical news-driven price spikes tend to be short-lived and are likely to encounter resistance and fall back. Editor's Summary: The current crude oil market exhibits a typical combination of "geopolitical impulsive support + supply and demand fundamentals suppression." The US military's strike on Iran targets boosted risk premiums, leading to a short-term rebound. However, medium- to long-term bearish factors such as the IEA's oversupply expectations, inventory accumulation, and continued reserve releases limit the upside potential. The daily chart shows a intact bearish structure, with indicators approaching oversold levels, suggesting the market will likely maintain a weak and volatile trend. Tonight's EIA inventory report is a key short-term variable; inventory reduction would be beneficial for a rebound, while inventory accumulation could easily lead to further weakness.
- Risk Warning and Disclaimer
- The market involves risk, and trading may not be suitable for all investors. This article is for reference only and does not constitute personal investment advice, nor does it take into account certain users’ specific investment objectives, financial situation, or other needs. Any investment decisions made based on this information are at your own risk.