Gold's technicals are weakening. Will the bears take further control of the situation?
2025-07-29 20:19:24
On Tuesday (July 29), spot gold prices saw slight consolidation, trading around $3,320 before the U.S. market opened. Cautious market sentiment is currently prevailing due to the upcoming release of the latest U.S. Job Openings and Labor Turnover Survey (JOLTS) report and the Federal Reserve's upcoming policy decision on Wednesday, which has put both bulls and bears on the sidelines.

Data indicates that the US labor market is still experiencing a mild cooling. The JOLTS job openings figure has been declining since reaching a peak of 12 million in March 2022. It dipped to just above 7.7 million in January and hit a low of 7.2 million in March, but then rebounded for two consecutive months, reaching 7.76 million in May. Market consensus is for a slight decline to 7.55 million in June.
This forecast holds significant market guidance. On the one hand, the steady decline in jobs suggests a more balanced labor market, helping to mitigate inflationary pressures from wage growth. On the other hand, if the actual data unexpectedly falls below the 7 million mark, it would significantly increase expectations of a September rate cut by the Federal Reserve, a probability currently hovering around 60% on the CME FedWatch tool.
Meanwhile, the United States reached tariff agreements with Japan and the European Union, alleviating short-term concerns about supply chain disruptions. Consequently, the US dollar remained strong despite its diminished safe-haven status, with the US dollar index (DXY) hitting a one-month high near 99. This strong dollar undoubtedly weighed on gold, making it difficult for prices to mount a meaningful rebound.
As for the Federal Reserve, the market generally expects it to maintain interest rates at 4.25% to 4.50% at this week's meeting, marking the fifth consecutive period of no change. However, if the JOLTS data weakens significantly, the Fed may send a stronger easing signal in its post-meeting statement. If this happens, gold may find new support.
Gold's daily Bollinger Bands chart shows a clear sideways consolidation pattern. The middle Bollinger Band is located near $3,338, while the price is currently trading below it, reflecting a weak short-term outlook. The upper Bollinger Band provides key resistance near $3,402, while the lower Bollinger Band offers support near $3,274, effectively limiting the price range. Analysts believe a break below $3,270 could open up further downside potential.
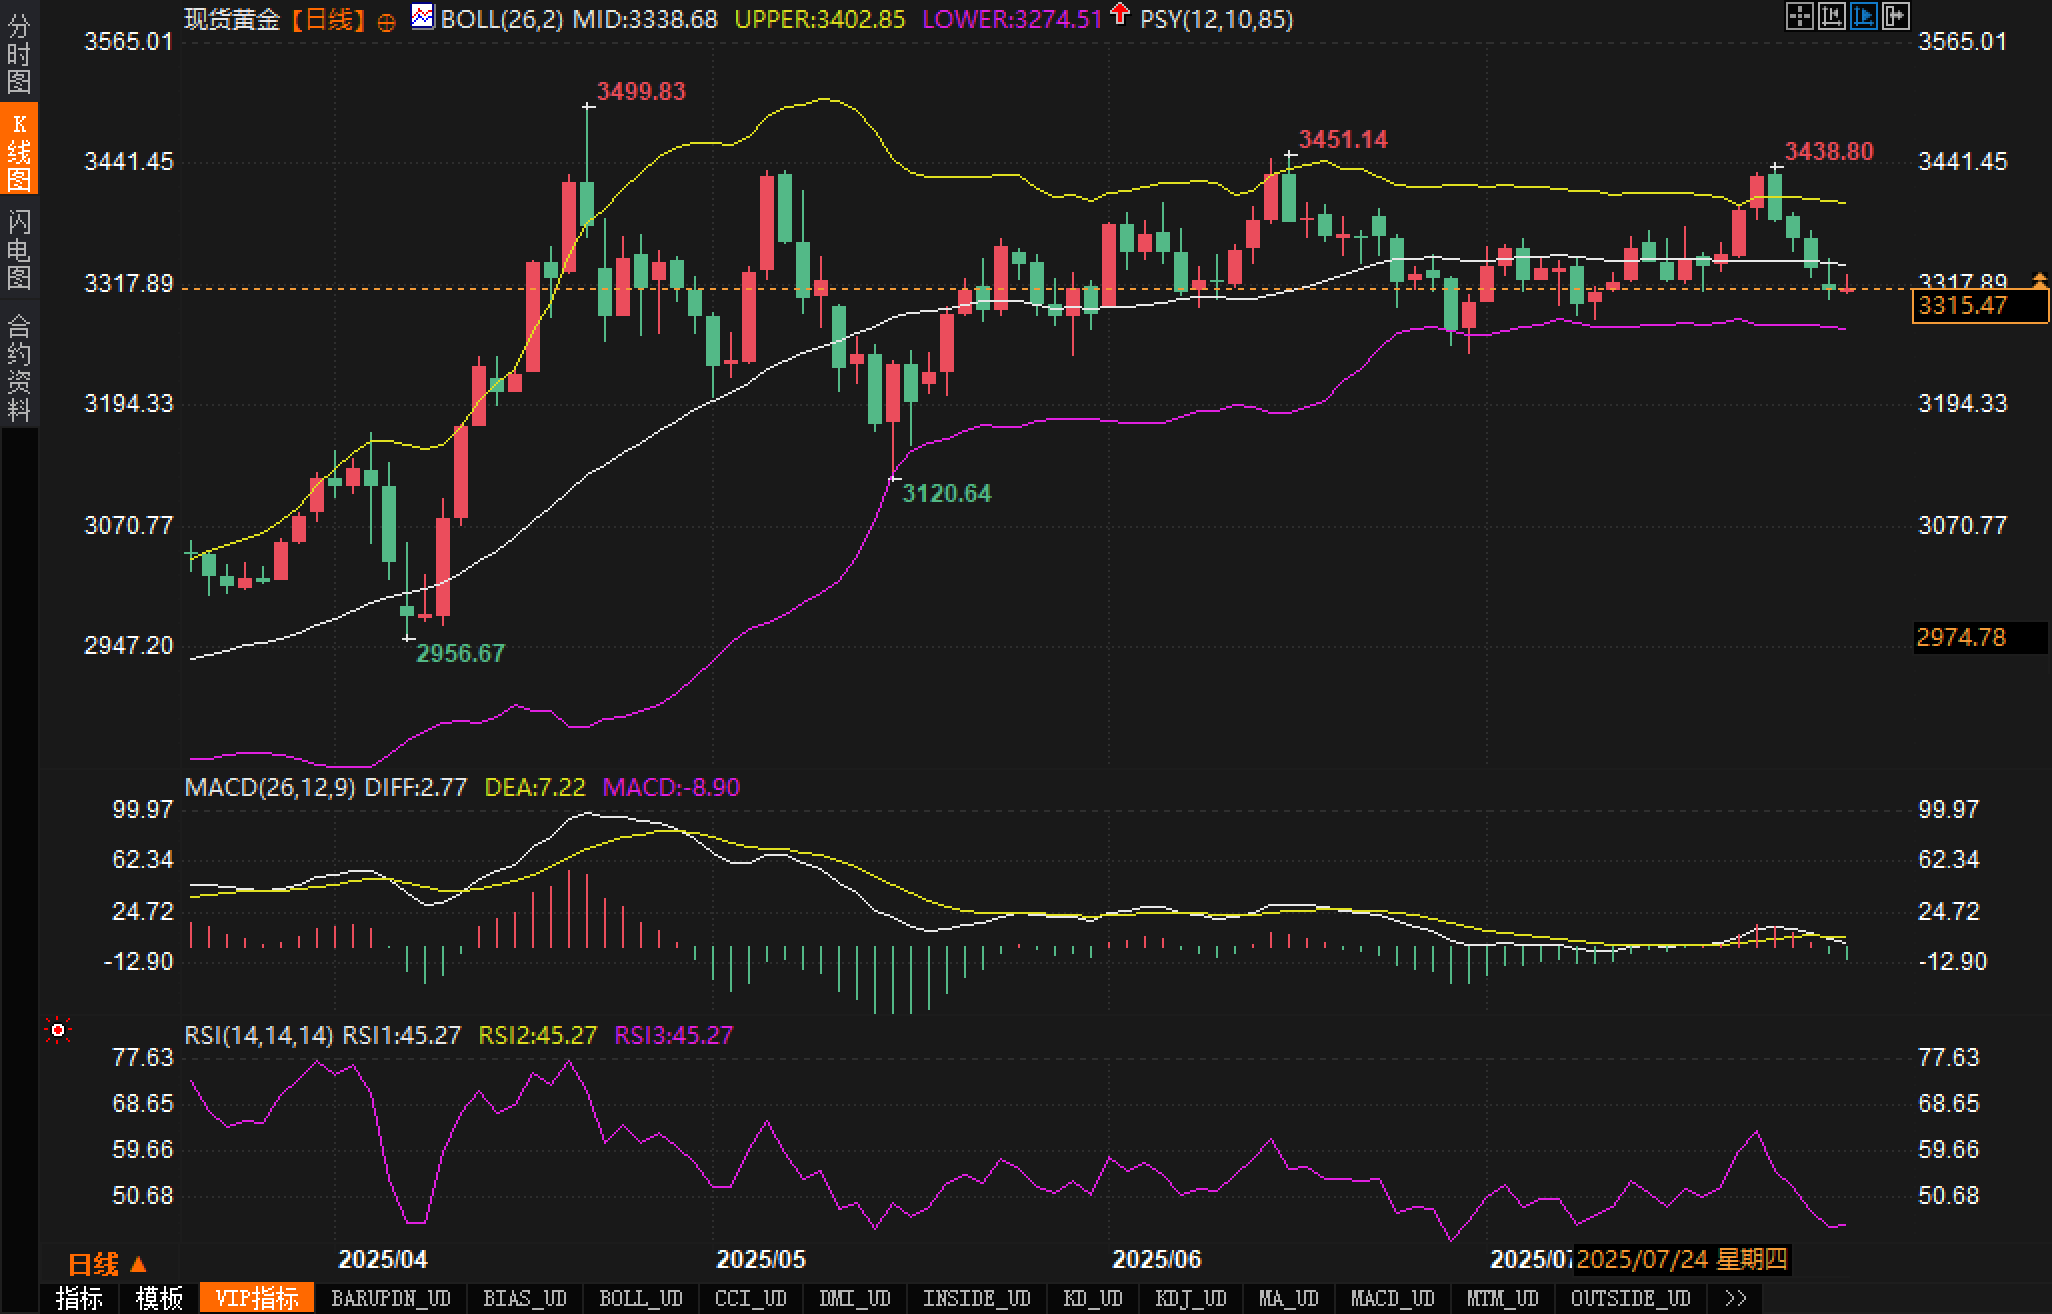
Regarding the MACD indicator, the fast line (DIFF) remains at 2.77, while the slow line (DEA) is at 7.22, with both lines continuing to converge near the zero axis. The MACD histogram is in negative territory, currently at -8.90, indicating that bearish momentum has not significantly weakened. Analysts believe that if a golden cross fails to form in the short term, gold prices will continue to fluctuate at low levels.
The RSI indicator is currently at 45.27, which is in the neutral to weak zone, indicating that buying power is limited. If the RSI falls further below 40, it means that selling pressure may accelerate and the price may test the previous low of $3120 in the short term.
Overall, the analysis shows that the price of gold rebounded from a low of $2,956 to a high of $3,499, but after hitting $3,451, the momentum gradually weakened. It is currently in a typical volatile correction phase and is technically biased towards the short side.
Recent market sentiment has been characterized by a mix of caution and wait-and-see attitudes. The tariff agreement has eased recession fears, boosted the US dollar, and weakened gold's safe-haven demand. While the market has reached a consensus on the Federal Reserve keeping interest rates unchanged this week, significant disagreements remain regarding the future policy path.
If the JOLTS data falls significantly short of expectations, it will fuel strong market expectations of a September rate cut, triggering a pullback in the US dollar and boosting gold prices. Conversely, if the data is close to or exceeds expectations, gold may struggle to escape downward pressure, and the market may continue to cut long positions. Overall sentiment is cautious, with traders opting to wait for the Fed's statement before re-entering the market.
Short-term outlook:
Gold prices are expected to continue to fluctuate and consolidate in the short-term range of $3,270 to $3,400, as the market awaits guidance from the JOLTS and Federal Reserve meetings. Analysts believe that if the data is bearish for the US dollar, gold prices are expected to rebound quickly and challenge the $3,400 resistance level. Conversely, if the US dollar remains strong, gold prices could fall towards $3,270 or even test the key support level of $3,120.
Medium- to long-term outlook:
From a medium- to long-term perspective, analysts believe that if the Federal Reserve starts a rate cut cycle in September, gold is expected to usher in a structural rebound and re-test the $3,450 or even $3,500 level; on the contrary, if high inflation forces the Federal Reserve to continue to maintain high interest rates, gold may fall into an extended consolidation pattern and even retreat to around the $3,000 mark.
Fundamentals
Data indicates that the US labor market is still experiencing a mild cooling. The JOLTS job openings figure has been declining since reaching a peak of 12 million in March 2022. It dipped to just above 7.7 million in January and hit a low of 7.2 million in March, but then rebounded for two consecutive months, reaching 7.76 million in May. Market consensus is for a slight decline to 7.55 million in June.
This forecast holds significant market guidance. On the one hand, the steady decline in jobs suggests a more balanced labor market, helping to mitigate inflationary pressures from wage growth. On the other hand, if the actual data unexpectedly falls below the 7 million mark, it would significantly increase expectations of a September rate cut by the Federal Reserve, a probability currently hovering around 60% on the CME FedWatch tool.
Meanwhile, the United States reached tariff agreements with Japan and the European Union, alleviating short-term concerns about supply chain disruptions. Consequently, the US dollar remained strong despite its diminished safe-haven status, with the US dollar index (DXY) hitting a one-month high near 99. This strong dollar undoubtedly weighed on gold, making it difficult for prices to mount a meaningful rebound.
As for the Federal Reserve, the market generally expects it to maintain interest rates at 4.25% to 4.50% at this week's meeting, marking the fifth consecutive period of no change. However, if the JOLTS data weakens significantly, the Fed may send a stronger easing signal in its post-meeting statement. If this happens, gold may find new support.
Technical aspects:
Gold's daily Bollinger Bands chart shows a clear sideways consolidation pattern. The middle Bollinger Band is located near $3,338, while the price is currently trading below it, reflecting a weak short-term outlook. The upper Bollinger Band provides key resistance near $3,402, while the lower Bollinger Band offers support near $3,274, effectively limiting the price range. Analysts believe a break below $3,270 could open up further downside potential.
Regarding the MACD indicator, the fast line (DIFF) remains at 2.77, while the slow line (DEA) is at 7.22, with both lines continuing to converge near the zero axis. The MACD histogram is in negative territory, currently at -8.90, indicating that bearish momentum has not significantly weakened. Analysts believe that if a golden cross fails to form in the short term, gold prices will continue to fluctuate at low levels.
The RSI indicator is currently at 45.27, which is in the neutral to weak zone, indicating that buying power is limited. If the RSI falls further below 40, it means that selling pressure may accelerate and the price may test the previous low of $3120 in the short term.
Overall, the analysis shows that the price of gold rebounded from a low of $2,956 to a high of $3,499, but after hitting $3,451, the momentum gradually weakened. It is currently in a typical volatile correction phase and is technically biased towards the short side.
Market Sentiment Observation
Recent market sentiment has been characterized by a mix of caution and wait-and-see attitudes. The tariff agreement has eased recession fears, boosted the US dollar, and weakened gold's safe-haven demand. While the market has reached a consensus on the Federal Reserve keeping interest rates unchanged this week, significant disagreements remain regarding the future policy path.
If the JOLTS data falls significantly short of expectations, it will fuel strong market expectations of a September rate cut, triggering a pullback in the US dollar and boosting gold prices. Conversely, if the data is close to or exceeds expectations, gold may struggle to escape downward pressure, and the market may continue to cut long positions. Overall sentiment is cautious, with traders opting to wait for the Fed's statement before re-entering the market.
Outlook
Short-term outlook:
Gold prices are expected to continue to fluctuate and consolidate in the short-term range of $3,270 to $3,400, as the market awaits guidance from the JOLTS and Federal Reserve meetings. Analysts believe that if the data is bearish for the US dollar, gold prices are expected to rebound quickly and challenge the $3,400 resistance level. Conversely, if the US dollar remains strong, gold prices could fall towards $3,270 or even test the key support level of $3,120.
Medium- to long-term outlook:
From a medium- to long-term perspective, analysts believe that if the Federal Reserve starts a rate cut cycle in September, gold is expected to usher in a structural rebound and re-test the $3,450 or even $3,500 level; on the contrary, if high inflation forces the Federal Reserve to continue to maintain high interest rates, gold may fall into an extended consolidation pattern and even retreat to around the $3,000 mark.
- Risk Warning and Disclaimer
- The market involves risk, and trading may not be suitable for all investors. This article is for reference only and does not constitute personal investment advice, nor does it take into account certain users’ specific investment objectives, financial situation, or other needs. Any investment decisions made based on this information are at your own risk.