A chart showing 56 US employment indicators after the non-farm payroll report shows a 1:1 bullish/bearish ratio for gold.
2025-08-01 21:25:32
The latest US non-farm payroll report was released at 8:30 PM on August 1, 2025, and is being closely watched by the market. This "non-farm payroll report," a must-read for the financial markets, provides an overall picture of the 56 US employment indicators following this release. These three charts provide a clearer overview.
A chart shows 56 US employment-related indicators released since the US non-farm payroll report, 25 of which are bullish for gold. The table shows the latest non-farm payroll and related indicators compared to the previous readings, showing 25 bullish for gold, 25 bearish, and 6 neutral. The number of positive indicators equals the number of negative indicators, resulting in a neutral impact. 25 bullish for gold (a bullish/bearish ratio of 1).
Regarding crude oil, theoretically bullish US indicators for gold are bearish for oil prices. Analysts note that when the market reacts to data like the US non-farm payroll report, oil prices often briefly move in the opposite direction of the US dollar (a so-called knee-jerk reaction), but crude oil quickly recovers and moves in the same direction as the US dollar index (which can be understood as a response to the strength of fundamentals).
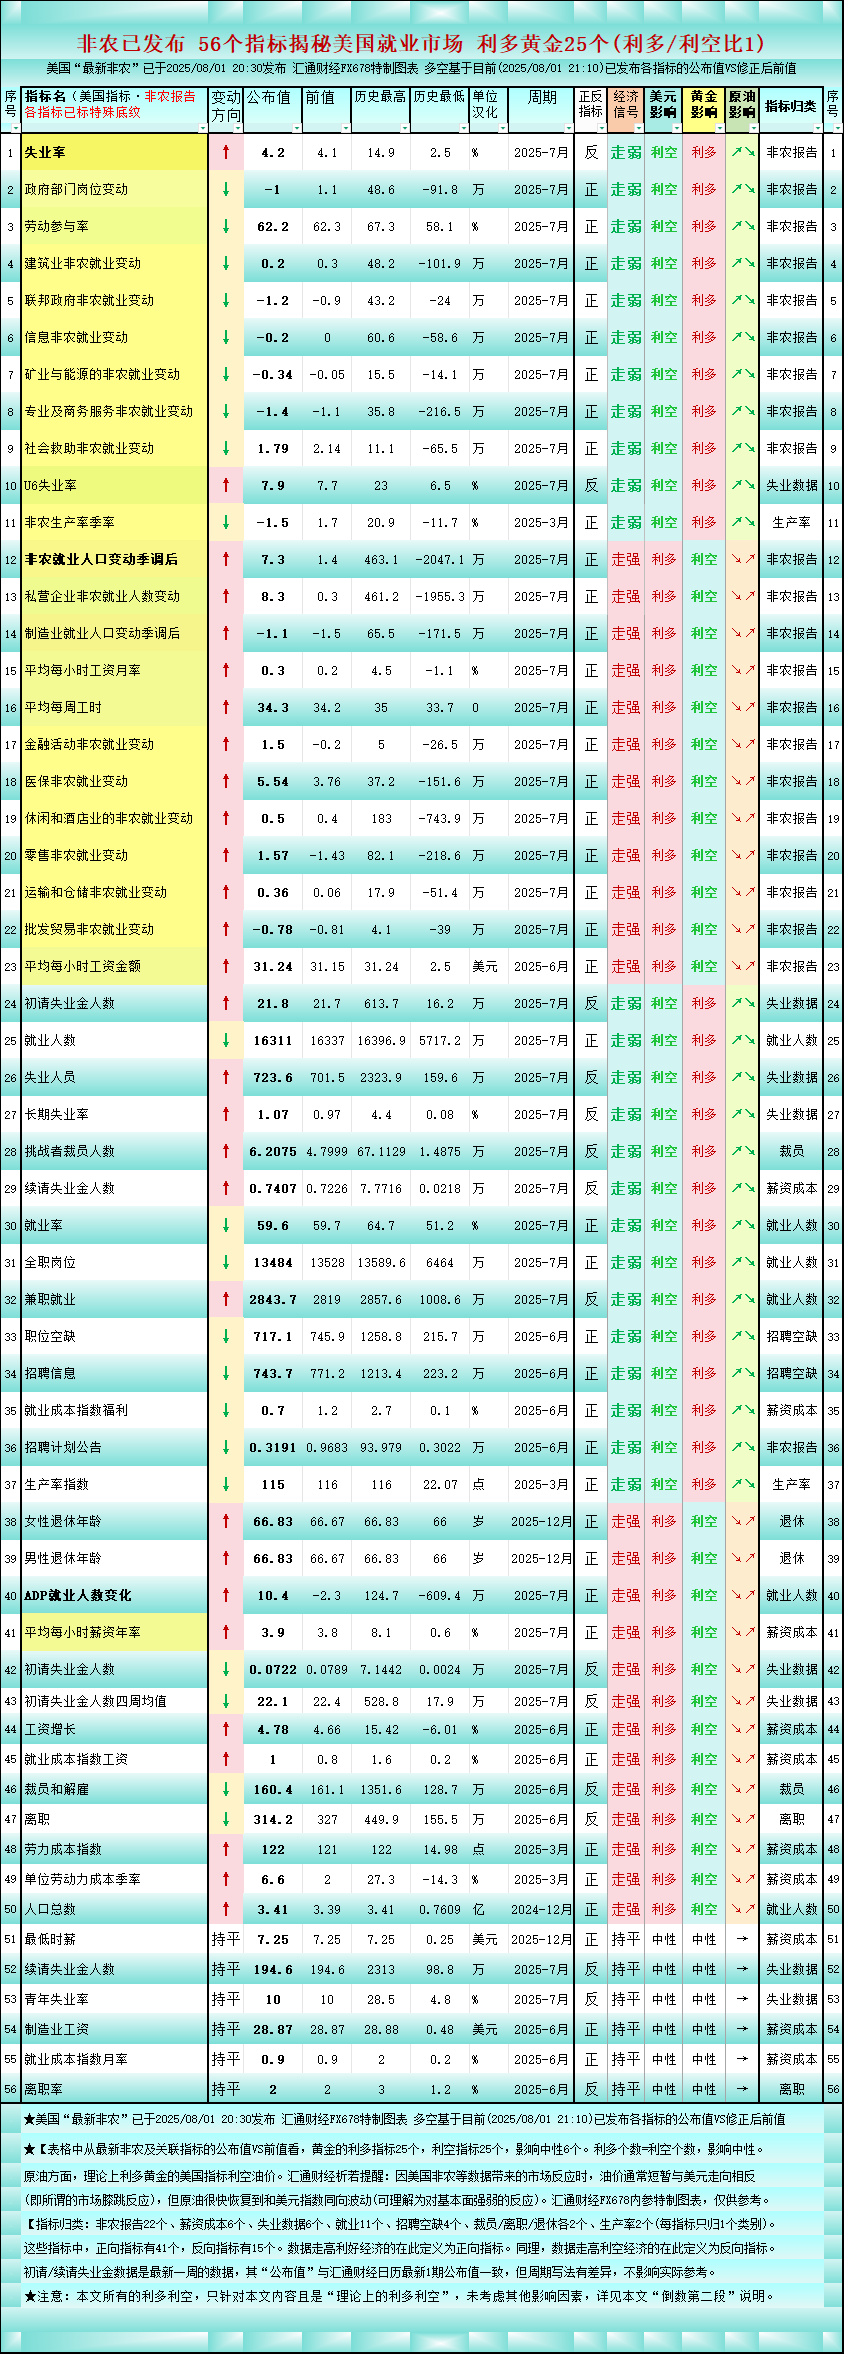
(Above: 56 indicators released by the non-farm payrolls reveal the US job market, 25 of which are bullish for gold (bullish/bearish ratio 1) Source: Huitong Finance FX678 special chart. The bullish and bearish positions in this chart are based on the latest US non-farm payroll data released so far (as of 2025/08/01 20:30) and the comparison results of the previous value.
Indicator Categories: Non-farm payroll reports (22), payroll costs (6), unemployment data (6), employment (11), job openings (4), layoffs/resignations/retirements (2 each), and productivity (2) (each indicator is classified into only one category). ★Of these indicators, there are 41 positive indicators and 15 negative indicators. A positive indicator is defined as one indicator if the data is bullish for the economy. Similarly, a negative indicator is defined as one negative indicator.
Note: All bullish and bearish factors in this article refer only to the 42 US employment indicators shown in the charts; other influencing factors are not considered. Furthermore, these are "theoretical bullish and bearish factors." Actual market conditions may contradict these theoretical assumptions. For example, a typical scenario where all negative news becomes bullish, or vice versa, can lead to theoretically positive market conditions but actual market declines, and vice versa. For another example, if a certain technical indicator is in a downtrend, positive factors may cause the market to surge, but after the surge, it may be met with concentrated selling, causing a deeper decline. However, studying "theoretical bullish and bearish factors" can be an important reference for planning and analyzing trading decisions. The specific references will depend on the trading environment, other factors, and the trader's individual trading strategy and mindset.
This article is original content from Huitong Finance and is copyrighted. It is for reference only and should not be used as a basis for trading.
A chart shows 56 US employment-related indicators released since the US non-farm payroll report, 25 of which are bullish for gold. The table shows the latest non-farm payroll and related indicators compared to the previous readings, showing 25 bullish for gold, 25 bearish, and 6 neutral. The number of positive indicators equals the number of negative indicators, resulting in a neutral impact. 25 bullish for gold (a bullish/bearish ratio of 1).
Regarding crude oil, theoretically bullish US indicators for gold are bearish for oil prices. Analysts note that when the market reacts to data like the US non-farm payroll report, oil prices often briefly move in the opposite direction of the US dollar (a so-called knee-jerk reaction), but crude oil quickly recovers and moves in the same direction as the US dollar index (which can be understood as a response to the strength of fundamentals).
(Above: 56 indicators released by the non-farm payrolls reveal the US job market, 25 of which are bullish for gold (bullish/bearish ratio 1) Source: Huitong Finance FX678 special chart. The bullish and bearish positions in this chart are based on the latest US non-farm payroll data released so far (as of 2025/08/01 20:30) and the comparison results of the previous value.
Indicator Categories: Non-farm payroll reports (22), payroll costs (6), unemployment data (6), employment (11), job openings (4), layoffs/resignations/retirements (2 each), and productivity (2) (each indicator is classified into only one category). ★Of these indicators, there are 41 positive indicators and 15 negative indicators. A positive indicator is defined as one indicator if the data is bullish for the economy. Similarly, a negative indicator is defined as one negative indicator.
Note: All bullish and bearish factors in this article refer only to the 42 US employment indicators shown in the charts; other influencing factors are not considered. Furthermore, these are "theoretical bullish and bearish factors." Actual market conditions may contradict these theoretical assumptions. For example, a typical scenario where all negative news becomes bullish, or vice versa, can lead to theoretically positive market conditions but actual market declines, and vice versa. For another example, if a certain technical indicator is in a downtrend, positive factors may cause the market to surge, but after the surge, it may be met with concentrated selling, causing a deeper decline. However, studying "theoretical bullish and bearish factors" can be an important reference for planning and analyzing trading decisions. The specific references will depend on the trading environment, other factors, and the trader's individual trading strategy and mindset.
This article is original content from Huitong Finance and is copyrighted. It is for reference only and should not be used as a basis for trading.
- Risk Warning and Disclaimer
- The market involves risk, and trading may not be suitable for all investors. This article is for reference only and does not constitute personal investment advice, nor does it take into account certain users’ specific investment objectives, financial situation, or other needs. Any investment decisions made based on this information are at your own risk.