Gold Analysis: Trump and Treasury Secretary Benson add fuel to bullish market
2025-08-14 18:05:55
When both President Trump and the U.S. Treasury Secretary are calling for interest rate cuts of hundreds of basis points, and the U.S. government has just announced a monthly deficit of nearly $300 billion, the unemployment rate is 4.2%, and inflation remains well above target, it is difficult to ignore hard assets with scarcity value like gold.

Gold's appeal is even stronger as long-term bonds appear to be cooperating in pushing short-term interest rates lower.
Gold is consolidating within a well-defined symmetrical triangle. Traders should be wary of a potential explosive bullish breakout in gold if highly expansionary fiscal policy overlaps with extremely loose monetary policy.
Trump and Bessant put pressure on Fed
This week, Trump and Treasury Secretary Jeff Bessant increased pressure on the Federal Reserve, both calling for a significant interest rate cut. Trump said rates should be lowered by another 300 to 400 basis points and confirmed that he will soon nominate a successor to Powell as Fed Chair, potentially before the end of Powell's current term. Bessant was more specific, calling for a 150 to 175 basis point rate cut starting in September, with an initial 50 basis point cut in September. He also suggested that revised labor market data should have supported an earlier rate cut. He also revealed that the administration is considering as many as 11 candidates for Fed Chair.
The push for a "shadow Fed" comes as Trump has been criticizing Powell's decision to keep interest rates unchanged, warning that high borrowing costs are hurting businesses, consumers and homebuyers. While Bessant's call isn't far off from current market thinking, his dovish tone exacerbates the recent shift in interest rate expectations.
Given Trump’s tendency to choose people closely aligned with his agenda for key appointments—including his recent nominee for head of the Bureau of Labor Statistics—the likelihood of a dovish Fed boss appears slim. History suggests he’s more likely to choose someone who will satisfy his desire for big, fast rate cuts than one who will challenge them.
Markets acquiesce to dovish deviations
For now, markets remain receptive to the evolving macroeconomic backdrop. Both short- and long-term U.S. Treasury yields have retreated further from their highs earlier this year, and the yield curve has exhibited a bull-steepening pattern—typically seen at the beginning of a reflationary period. While inflation expectations are above target, they remain within the range seen over the past two years. All is calm: equity market volatility is unusually low, while bond market volatility has fallen to its lowest level since early 2022, when quantitative easing was in full swing and inflation was clearly considered transitory.
Calm markets and growing certainty about a series of impending rate cuts are weighing on the dollar. This is also creating a favorable environment for gold and other precious metals, even without considering the risks of rising volatility or inflationary pressures—risks that are significantly underpriced for those who are not currently levered long risk assets.
From a fundamental perspective, the path of least resistance for gold appears to be to the upside rather than the downside. The technical picture is not too bad for the bulls either.
Technical Analysis: Gold Consolidating, Bullish Breakout Imminent?
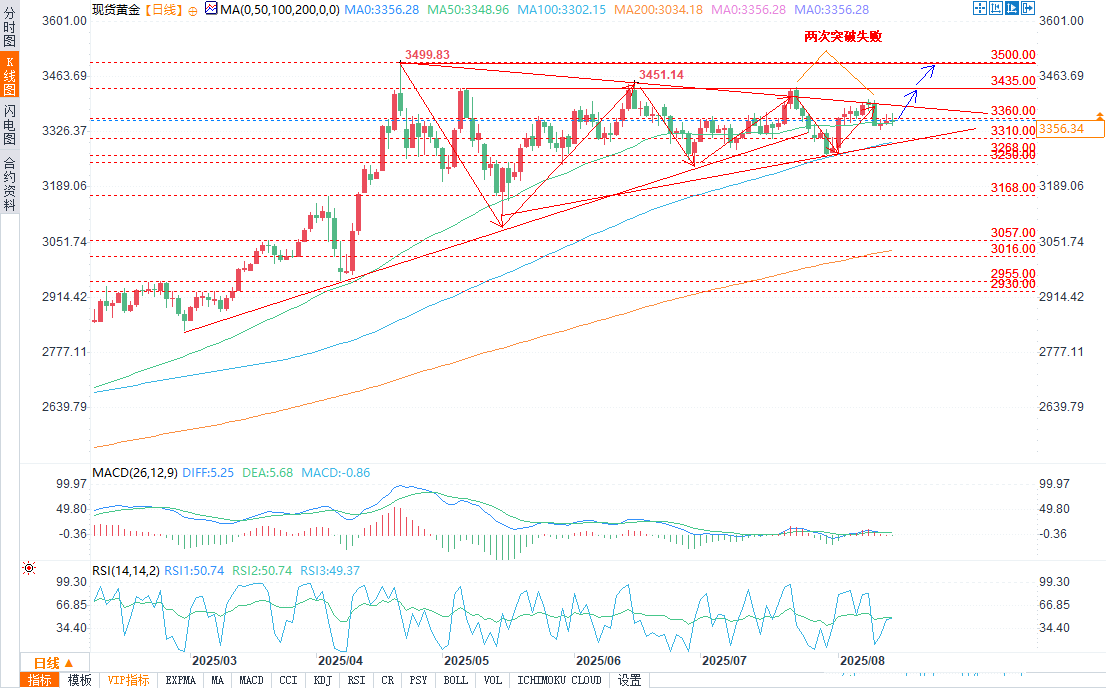
(Source of spot gold daily chart: Yihuitong)
Gold continues to consolidate within a symmetrical triangle pattern, testing downtrend resistance multiple times over the past month. It has already seen two false breakouts, including one earlier this month. However, with other hard assets with a scarcity premium performing strongly, a retest of this resistance level could signal a potential three-for-one breakout.
If gold breaks out and closes above the downtrend line from April, the first hurdle for bulls will be the $3,435 horizontal resistance level, which has held back gains on three previous attempts. As usual, if this resistance level falls after a bullish triangle breakout, the current all-time high of $3,500 will come into view.
If gold fails to break through the downtrend resistance, downside support levels worth watching include $3,360, $3,334 and $3,310, and further down is the rising trend line since the May low, around $3,300.
I describe the overall pattern as a triangle, but it's important to note that the rising trendline has only been touched twice, yet gold continues to make higher lows, which keeps the consolidation pattern going. This makes it more likely that a breakout, if it eventually occurs, will be to the upside rather than the downside.
Momentum indicators on the daily chart are slightly bullish, but the relative strength index (RSI, 14) and the moving average convergence divergence (MACD) are not giving strong buy signals. Therefore, decisions should be based more on price signals.
At 17:35 Beijing time, spot gold was quoted at US$3,356.56 per ounce, up 0.02%.
Gold's appeal is even stronger as long-term bonds appear to be cooperating in pushing short-term interest rates lower.
Gold is consolidating within a well-defined symmetrical triangle. Traders should be wary of a potential explosive bullish breakout in gold if highly expansionary fiscal policy overlaps with extremely loose monetary policy.
Trump and Bessant put pressure on Fed
This week, Trump and Treasury Secretary Jeff Bessant increased pressure on the Federal Reserve, both calling for a significant interest rate cut. Trump said rates should be lowered by another 300 to 400 basis points and confirmed that he will soon nominate a successor to Powell as Fed Chair, potentially before the end of Powell's current term. Bessant was more specific, calling for a 150 to 175 basis point rate cut starting in September, with an initial 50 basis point cut in September. He also suggested that revised labor market data should have supported an earlier rate cut. He also revealed that the administration is considering as many as 11 candidates for Fed Chair.
The push for a "shadow Fed" comes as Trump has been criticizing Powell's decision to keep interest rates unchanged, warning that high borrowing costs are hurting businesses, consumers and homebuyers. While Bessant's call isn't far off from current market thinking, his dovish tone exacerbates the recent shift in interest rate expectations.
Given Trump’s tendency to choose people closely aligned with his agenda for key appointments—including his recent nominee for head of the Bureau of Labor Statistics—the likelihood of a dovish Fed boss appears slim. History suggests he’s more likely to choose someone who will satisfy his desire for big, fast rate cuts than one who will challenge them.
Markets acquiesce to dovish deviations
For now, markets remain receptive to the evolving macroeconomic backdrop. Both short- and long-term U.S. Treasury yields have retreated further from their highs earlier this year, and the yield curve has exhibited a bull-steepening pattern—typically seen at the beginning of a reflationary period. While inflation expectations are above target, they remain within the range seen over the past two years. All is calm: equity market volatility is unusually low, while bond market volatility has fallen to its lowest level since early 2022, when quantitative easing was in full swing and inflation was clearly considered transitory.
Calm markets and growing certainty about a series of impending rate cuts are weighing on the dollar. This is also creating a favorable environment for gold and other precious metals, even without considering the risks of rising volatility or inflationary pressures—risks that are significantly underpriced for those who are not currently levered long risk assets.
From a fundamental perspective, the path of least resistance for gold appears to be to the upside rather than the downside. The technical picture is not too bad for the bulls either.
Technical Analysis: Gold Consolidating, Bullish Breakout Imminent?
(Source of spot gold daily chart: Yihuitong)
Gold continues to consolidate within a symmetrical triangle pattern, testing downtrend resistance multiple times over the past month. It has already seen two false breakouts, including one earlier this month. However, with other hard assets with a scarcity premium performing strongly, a retest of this resistance level could signal a potential three-for-one breakout.
If gold breaks out and closes above the downtrend line from April, the first hurdle for bulls will be the $3,435 horizontal resistance level, which has held back gains on three previous attempts. As usual, if this resistance level falls after a bullish triangle breakout, the current all-time high of $3,500 will come into view.
If gold fails to break through the downtrend resistance, downside support levels worth watching include $3,360, $3,334 and $3,310, and further down is the rising trend line since the May low, around $3,300.
I describe the overall pattern as a triangle, but it's important to note that the rising trendline has only been touched twice, yet gold continues to make higher lows, which keeps the consolidation pattern going. This makes it more likely that a breakout, if it eventually occurs, will be to the upside rather than the downside.
Momentum indicators on the daily chart are slightly bullish, but the relative strength index (RSI, 14) and the moving average convergence divergence (MACD) are not giving strong buy signals. Therefore, decisions should be based more on price signals.
At 17:35 Beijing time, spot gold was quoted at US$3,356.56 per ounce, up 0.02%.
- Risk Warning and Disclaimer
- The market involves risk, and trading may not be suitable for all investors. This article is for reference only and does not constitute personal investment advice, nor does it take into account certain users’ specific investment objectives, financial situation, or other needs. Any investment decisions made based on this information are at your own risk.