From data to market: How can gold maintain its high structure?
2025-09-04 19:43:13
On Thursday (September 4th), spot gold prices dipped slightly, fluctuating around $3,540 before the US market opened, driven by profit-taking after seven consecutive days of gains. Bulls had pushed gold prices to a record high near $3,578 in the previous trading day. The rally, which began at $3,310 on August 20th, has seen a cumulative increase of over 7%. Since stabilizing at $3,500, it has risen an additional approximately 2%. The market is currently cautious ahead of the release of key macroeconomic data, and short-term fluctuations have returned to a more rational level, but the strong underlying trend remains intact.

The core driver of the latest rally remains the increased pricing in of a Federal Reserve rate cut this month. Recent marginal weakening in employment data has provided cover for a policy shift: Wednesday's JOLTS job openings fell to 7.18 million, down from the previously revised 7.35 million, reinforcing signs of a continued cooling in labor demand. In line with this, the US dollar has staged a modest rebound below its previous high, lacking sustainability. The "debt concerns" sparked by a sharp rise in US Treasury yields this week have since receded, and risk appetite in financial markets has stabilized. This provides short-term justification for gold to cash in, but does not alter the structural support of medium-term risk aversion and allocation demand.
Political and policy uncertainty continues to provide a buffer for precious metals. The ongoing debate between the US executive and judicial authorities over the Federal Reserve and tariffs has heightened institutional noise, raising doubts about policy continuity and predictability in the market, thus benefiting gold from the demand for risk hedging. Meanwhile, Thursday's ADP, initial jobless claims, and ISM services data will serve as a warm-up for the non-farm payroll report, while Friday's NFP will be the final call on the pace and magnitude of interest rate cuts. If August employment again falls short of expectations, the market will be more resolute in its prediction of a rate cut this month, limiting the dollar's potential rebound and potentially curbing gold's pullback. Conversely, if employment rebounds significantly, gold will face a round of "data-verification" price corrections and repricing.
From the hourly chart, gold prices retreated after forming a periodic high at 3578.29, hitting a low of 3511.44 before fluctuating around 3540. Bollinger Bands show a slight convergence at high levels, with the upper band at 3577.30, the middle band at 3548.90, and the lower band at 3520.50. The bands are currently converging slightly at high levels, with prices currently confined within a narrow band below the middle band and above the lower band, reflecting consolidation at high levels following a strong trend. If the price manages to recapture and stabilize above 3548.90, it could retest the overlapping resistance windows of 3577.30 and 3578.29 in the short term, potentially breaking through the Fibonacci extension level at 3589 and the 3600 round number.
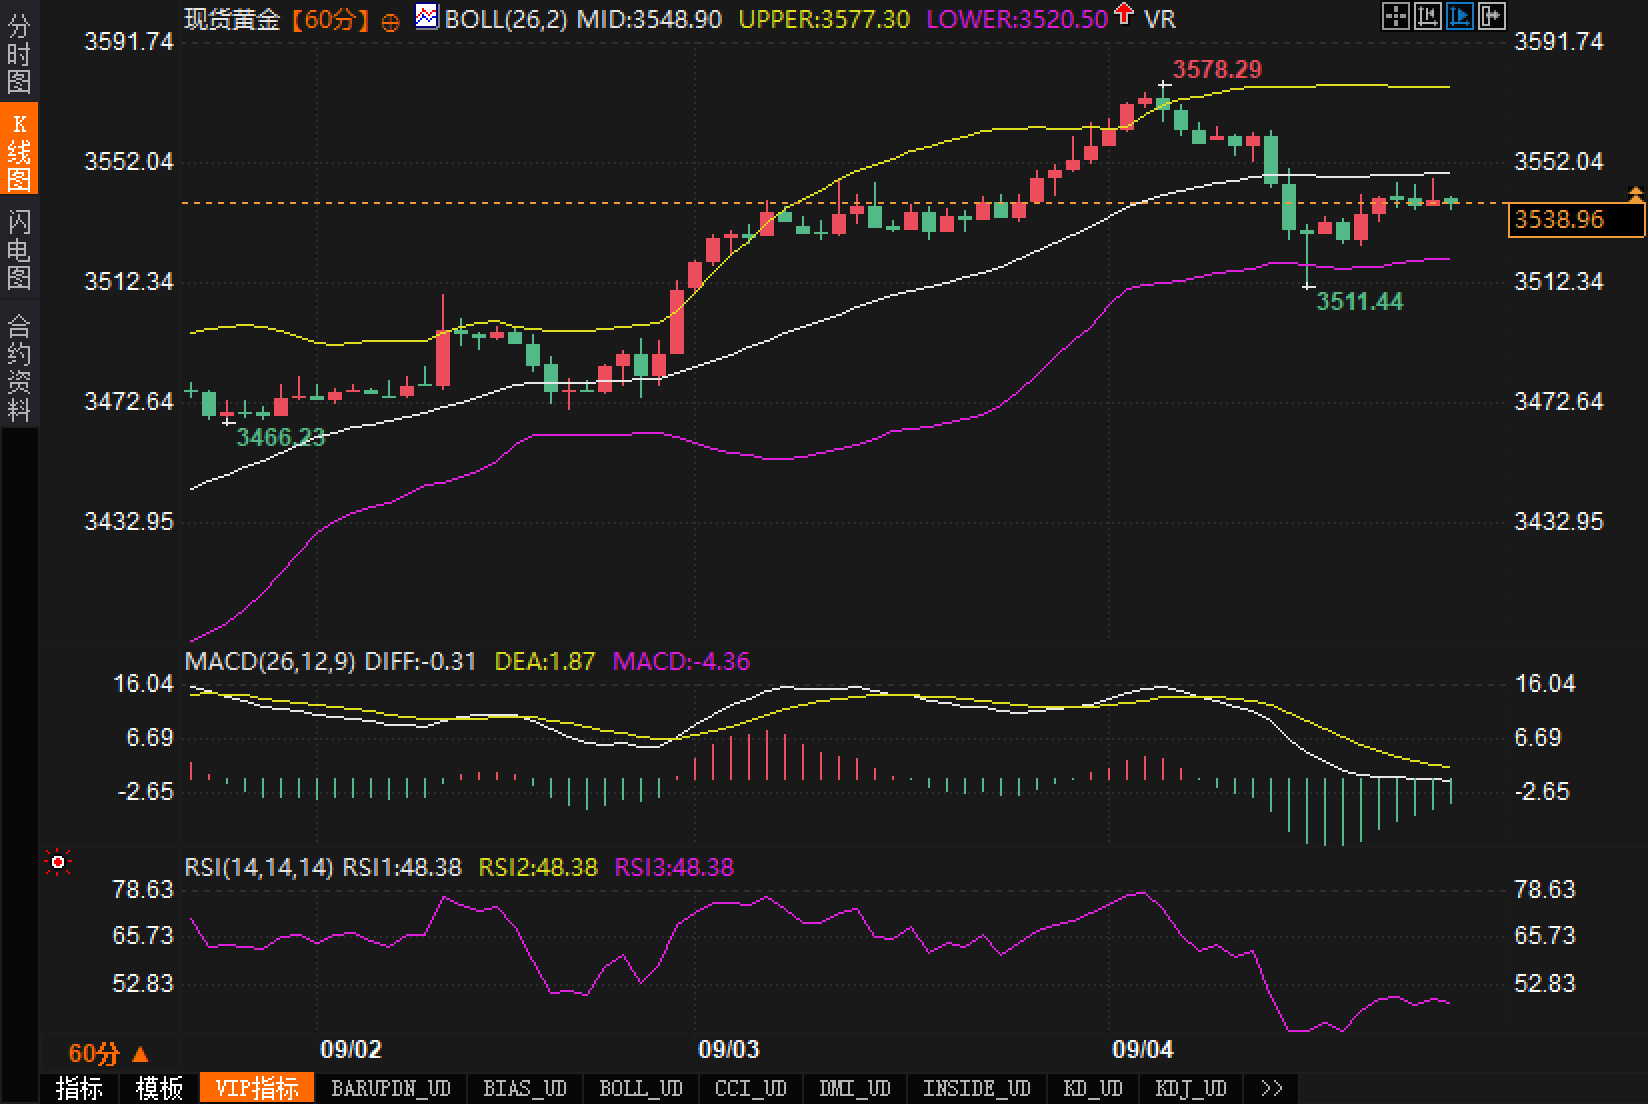
Regarding the MACD: DIFF is -0.31, still lower than the DEA's 1.87, and the histogram value is -4.36, but the negative bar is shorter than the previous period, indicating a "downward deceleration" in momentum; this usually corresponds to a technical pause in the trend rather than a reversal signal. The RSI (14) is around 48.38, and the oscillator has returned to the neutral zone, leaving ample room for subsequent direction selection.
On the whole, 3520.50 and 3511.44 constitute the key support bands at the hourly level, and the psychological level of 3500 is a deeper static support; the upper resistance is 3548.90, 3577.30 and 3578.29 respectively. Only after breaking through can it be expected to initiate a new round of trend extension to 3589/3600.
The acceleration of the past two weeks has caused some investors to experience "missing out" anxiety, while the subsequent pullback has triggered periodic profit-taking, causing short-term sentiment to rapidly shift between euphoria and caution. The simultaneous stabilization of equity and fixed income markets has reduced the urgent need for safe havens, thus cooling marginal buying of gold. Meanwhile, the modest rebound of the US dollar and stabilization of yields have placed external constraints on gold. Notably, the market consensus for a rate cut remains unchanged, and gold retains its hedging and diversification value from a risk-parity perspective. However, with the US non-farm payroll report and interest rate meeting approaching, leveraged funds are tending to reduce their positions and volatility exposure, which explains the "cooling" phenomenon, with the RSI returning to neutral and the MACD momentum weakening. Overall sentiment is a mixture of rational optimism and pre-event defensiveness: the impulse to chase gains has been curbed, but the desire to accumulate on pullbacks remains.
(I) Bullish Path: If data and policy communications continue to reinforce expectations of a rate cut this month, while the US dollar and yields lack a trending upward trend, gold is expected to build a higher platform. Technically, once it returns to and stabilizes at 3548.90 (the middle Bollinger band), it will quickly face dual resistance at 3577.30 and 3578.29. A confirmed breakout would position the price for a push towards 3589 (a Fibonacci projection) and the 3600 round number. In trend trading, round numbers often serve as both "magnetic levels" and "watersheds." If a breakout with significant volume is confirmed and a retracement is completed, the extension of the high-level channel will continue to dominate the market. In this scenario, the MACD is expected to form a golden cross and turn positive, and the RSI will return to the 60-70 range. The volume-price dynamics will re-emerge as a typical strong pattern of "high-volume rise followed by consolidation on shrinking volume."
(II) Bearish Path: If the non-farm payroll report is significantly stronger than expected, the US dollar strengthens, and yields climb again, the "repricing of policy easing" will trigger a deeper pullback in gold. A break below 3520.50 (the lower Bollinger band) will put pressure on the periodic low of 3511.44, turning the psychological level of 3500 into a short-term sentiment valve: liquidity below it may become scarce, and prices will enter a phase of "momentum-led mean reversion," followed by a widening of the Bollinger Bands and a weak swing in the RSI towards 40. It is important to emphasize that even in this scenario, given the continued expectations of rate cuts, the bearish trend is more like a "trend correction" than a medium- to long-term reversal, unless subsequent data is consistently and systematically strong and significantly raises real interest rates.
Fundamentals: Expectations of interest rate cuts support the market, while event risks curb the willingness to chase higher prices.
The core driver of the latest rally remains the increased pricing in of a Federal Reserve rate cut this month. Recent marginal weakening in employment data has provided cover for a policy shift: Wednesday's JOLTS job openings fell to 7.18 million, down from the previously revised 7.35 million, reinforcing signs of a continued cooling in labor demand. In line with this, the US dollar has staged a modest rebound below its previous high, lacking sustainability. The "debt concerns" sparked by a sharp rise in US Treasury yields this week have since receded, and risk appetite in financial markets has stabilized. This provides short-term justification for gold to cash in, but does not alter the structural support of medium-term risk aversion and allocation demand.
Political and policy uncertainty continues to provide a buffer for precious metals. The ongoing debate between the US executive and judicial authorities over the Federal Reserve and tariffs has heightened institutional noise, raising doubts about policy continuity and predictability in the market, thus benefiting gold from the demand for risk hedging. Meanwhile, Thursday's ADP, initial jobless claims, and ISM services data will serve as a warm-up for the non-farm payroll report, while Friday's NFP will be the final call on the pace and magnitude of interest rate cuts. If August employment again falls short of expectations, the market will be more resolute in its prediction of a rate cut this month, limiting the dollar's potential rebound and potentially curbing gold's pullback. Conversely, if employment rebounds significantly, gold will face a round of "data-verification" price corrections and repricing.
Technical aspects:
From the hourly chart, gold prices retreated after forming a periodic high at 3578.29, hitting a low of 3511.44 before fluctuating around 3540. Bollinger Bands show a slight convergence at high levels, with the upper band at 3577.30, the middle band at 3548.90, and the lower band at 3520.50. The bands are currently converging slightly at high levels, with prices currently confined within a narrow band below the middle band and above the lower band, reflecting consolidation at high levels following a strong trend. If the price manages to recapture and stabilize above 3548.90, it could retest the overlapping resistance windows of 3577.30 and 3578.29 in the short term, potentially breaking through the Fibonacci extension level at 3589 and the 3600 round number.
Regarding the MACD: DIFF is -0.31, still lower than the DEA's 1.87, and the histogram value is -4.36, but the negative bar is shorter than the previous period, indicating a "downward deceleration" in momentum; this usually corresponds to a technical pause in the trend rather than a reversal signal. The RSI (14) is around 48.38, and the oscillator has returned to the neutral zone, leaving ample room for subsequent direction selection.
On the whole, 3520.50 and 3511.44 constitute the key support bands at the hourly level, and the psychological level of 3500 is a deeper static support; the upper resistance is 3548.90, 3577.30 and 3578.29 respectively. Only after breaking through can it be expected to initiate a new round of trend extension to 3589/3600.
Market sentiment observation: high-level divergence intensifies, but bullish conviction remains unchanged
The acceleration of the past two weeks has caused some investors to experience "missing out" anxiety, while the subsequent pullback has triggered periodic profit-taking, causing short-term sentiment to rapidly shift between euphoria and caution. The simultaneous stabilization of equity and fixed income markets has reduced the urgent need for safe havens, thus cooling marginal buying of gold. Meanwhile, the modest rebound of the US dollar and stabilization of yields have placed external constraints on gold. Notably, the market consensus for a rate cut remains unchanged, and gold retains its hedging and diversification value from a risk-parity perspective. However, with the US non-farm payroll report and interest rate meeting approaching, leveraged funds are tending to reduce their positions and volatility exposure, which explains the "cooling" phenomenon, with the RSI returning to neutral and the MACD momentum weakening. Overall sentiment is a mixture of rational optimism and pre-event defensiveness: the impulse to chase gains has been curbed, but the desire to accumulate on pullbacks remains.
Market Outlook
(I) Bullish Path: If data and policy communications continue to reinforce expectations of a rate cut this month, while the US dollar and yields lack a trending upward trend, gold is expected to build a higher platform. Technically, once it returns to and stabilizes at 3548.90 (the middle Bollinger band), it will quickly face dual resistance at 3577.30 and 3578.29. A confirmed breakout would position the price for a push towards 3589 (a Fibonacci projection) and the 3600 round number. In trend trading, round numbers often serve as both "magnetic levels" and "watersheds." If a breakout with significant volume is confirmed and a retracement is completed, the extension of the high-level channel will continue to dominate the market. In this scenario, the MACD is expected to form a golden cross and turn positive, and the RSI will return to the 60-70 range. The volume-price dynamics will re-emerge as a typical strong pattern of "high-volume rise followed by consolidation on shrinking volume."
(II) Bearish Path: If the non-farm payroll report is significantly stronger than expected, the US dollar strengthens, and yields climb again, the "repricing of policy easing" will trigger a deeper pullback in gold. A break below 3520.50 (the lower Bollinger band) will put pressure on the periodic low of 3511.44, turning the psychological level of 3500 into a short-term sentiment valve: liquidity below it may become scarce, and prices will enter a phase of "momentum-led mean reversion," followed by a widening of the Bollinger Bands and a weak swing in the RSI towards 40. It is important to emphasize that even in this scenario, given the continued expectations of rate cuts, the bearish trend is more like a "trend correction" than a medium- to long-term reversal, unless subsequent data is consistently and systematically strong and significantly raises real interest rates.
- Risk Warning and Disclaimer
- The market involves risk, and trading may not be suitable for all investors. This article is for reference only and does not constitute personal investment advice, nor does it take into account certain users’ specific investment objectives, financial situation, or other needs. Any investment decisions made based on this information are at your own risk.