CPI Outlook: US CPI expectations support rate cuts, but the US dollar rises for three consecutive days?
2025-09-11 18:09:02
The US dollar index continued its rebound in the European session on Thursday (September 11th), marking the third consecutive day of gains. It is currently trading around 97.97, up 0.15%. The US will release CPI data that evening, and the market expects this inflation figure to show a slight increase, which would support the Federal Reserve's interest rate cut and weaken the US dollar index. However, the US dollar index has rebounded recently, indicating that the market has fully priced in a normal 25 basis point rate cut.
The market is gradually pricing in a larger rate cut. Following the end of the Federal Reserve's quiet period (a period established before each FOMC meeting to prevent officials' public comments from influencing market expectations of interest rate policy and interfering with monetary policy independence), the job market and Producer Price Index (PPI) have weakened simultaneously. If this month's CPI report continues this PPI trend and shows lower-than-expected price pressures, the likelihood of a 50 basis point "double-cut" rate cut by the Fed will increase further. This article provides a preview of the upcoming CPI data.

US CPI expectations: overall inflation is 2.9% year-on-year, and core inflation is 3.1% year-on-year. If the CPI report unexpectedly falls this week, the Federal Reserve's 50 basis point interest rate cut is expected to be formally taken into consideration, and dollar bulls may accelerate their closing of positions, causing the dollar index to quickly break down.
Traders and economists generally predict that the overall CPI will be recorded at 2.9% year-on-year, while the core CPI, which excludes food and energy prices, is expected to be 3.1% year-on-year. If both figures meet expectations, the inflation level will show a slight rebound from the previous month, supporting the Federal Reserve's interest rate cut.
Calendar peculiarity is an easily overlooked dimension of market volatility, and this month's economic data is a typical manifestation of this feature.
The Federal Reserve holds meetings on a semi-quarterly basis (approximately every 6-7 weeks), and its timing is often difficult to fully match with the monthly release rhythm of most core economic data.
Specifically, this month's non-farm payroll data (NFP) fell short of expectations, coinciding with the start of the Federal Reserve's media "quiet period." Therefore, before next week's monetary policy meeting, traders will not be able to obtain the latest views of Federal Reserve officials on the current employment market conditions.
The downward revision of previous employment data released yesterday was much larger than expected, further amplifying this information gap - we now know that the weakness in the job market has increased significantly since the last time Fed officials publicly stated it.
Turning to the other dimension of the Fed’s dual mandate: Wednesday’s US PPI report also missed expectations significantly (although remained roughly in line with recent readings since the second quarter).
Currently, after the end of the silent period, the employment market and producer prices have weakened simultaneously. If this month's CPI report continues the cooling trend of PPI and shows lower-than-expected price pressure, it will create space for the Federal Reserve to launch a double interest rate cut of 50 basis points.
From the overall trend, the process of US consumer inflation falling back to the Federal Reserve's 2% target has stagnated for more than a year, during which the overall CPI year-on-year has always hovered in the range of 2.3%-3.0%.
At the same time, the core CPI, which excludes more volatile food and energy prices and better reflects the underlying trend of prices, has rebounded in recent months after hitting a year-on-year low of 2.8% earlier this year.
This situation puts the Federal Reserve in a policy dilemma before its meeting next week: on the one hand, persistently higher-than-target inflation may limit its room for more aggressive interest rate cuts; on the other hand, aggressive rate cuts are necessary from the perspective of the job market dimension of its dual mandate.
Judging from the potential market reaction, if the CPI report unexpectedly declines this week, it may ease this policy contradiction and push the 50 basis point interest rate cut into formal consideration - as of this writing, the market is pricing in only a 10% probability for this scenario.
As most experienced traders know, technically, the Fed's core inflation indicator for policymaking is the Core Personal Consumption Expenditures (CorePCE). However, for trading purposes, the CPI report is at least as important. This is primarily because the CPI is released several weeks earlier than the CorePCE, providing greater guidance for short-term trading decisions. As we've previously noted, the CPI has generally declined this year, but has remained stubbornly above the Fed's 2% target.
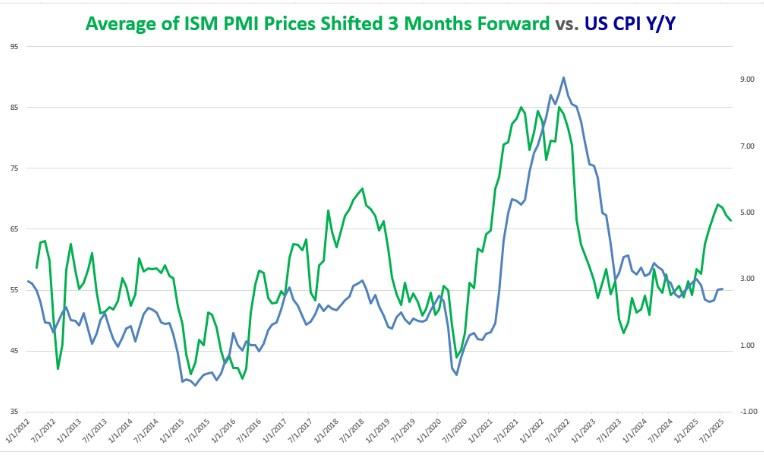
As can be seen from the above figure, the "price" sub-index in the Purchasing Managers' Index (PMI) has risen significantly in the past few months, and this trend even predates the Trump administration's formal announcement (and subsequent suspension) of the tariff policy.
Although current economic growth shows signs of slowing down, amidst continued uncertainty in trade policies, companies are forced to bear higher costs for goods and services, a factor that may put upward pressure on CPI in the coming months.
The US dollar index is in a rebound trend after a decline. The index broke below the box and rebounded back into the box. It is currently suppressed by the short-term moving average. The key pressure levels are the 98 integer mark and 98.30 above it. 97.70 is the key support price, which is the bottom of the box. The US dollar index broke below the bottom of the box and then rose back. This price is difficult to be broken in the short term. If it is broken, it will be regarded as the end of the rebound of the US dollar index and continue to develop downward.
The trend of the US dollar index means that the market has fully priced in the expectation of a 25 basis point interest rate cut by the US Federal Reserve. That is, if nothing unexpected happens, the US dollar index has temporarily bid farewell to the panic of interest rate cuts. But at the same time, US dollar bears may have also prepared bullets for the Fed's unexpected interest rate cuts. The recent rebound may also be that US dollar bears are accumulating strength and preparing chips. The rebound of the US dollar provides bears with a good position to build positions.
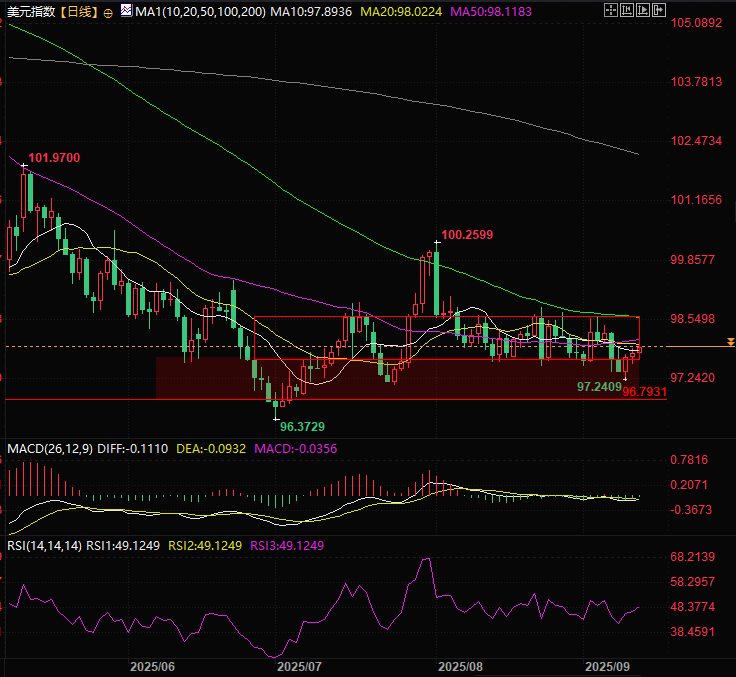
(Daily chart of the US dollar index, source: Yihuitong)
At 18:00 Beijing time, the US dollar index was currently at 97.96.
The market is gradually pricing in a larger rate cut. Following the end of the Federal Reserve's quiet period (a period established before each FOMC meeting to prevent officials' public comments from influencing market expectations of interest rate policy and interfering with monetary policy independence), the job market and Producer Price Index (PPI) have weakened simultaneously. If this month's CPI report continues this PPI trend and shows lower-than-expected price pressures, the likelihood of a 50 basis point "double-cut" rate cut by the Fed will increase further. This article provides a preview of the upcoming CPI data.
Key points of the US CPI:
US CPI expectations: overall inflation is 2.9% year-on-year, and core inflation is 3.1% year-on-year. If the CPI report unexpectedly falls this week, the Federal Reserve's 50 basis point interest rate cut is expected to be formally taken into consideration, and dollar bulls may accelerate their closing of positions, causing the dollar index to quickly break down.
What are the market expectations for the US CPI report?
Traders and economists generally predict that the overall CPI will be recorded at 2.9% year-on-year, while the core CPI, which excludes food and energy prices, is expected to be 3.1% year-on-year. If both figures meet expectations, the inflation level will show a slight rebound from the previous month, supporting the Federal Reserve's interest rate cut.
The misalignment between the rhythm of US CPI data and the policy environment
Calendar peculiarity is an easily overlooked dimension of market volatility, and this month's economic data is a typical manifestation of this feature.
The Federal Reserve holds meetings on a semi-quarterly basis (approximately every 6-7 weeks), and its timing is often difficult to fully match with the monthly release rhythm of most core economic data.
Specifically, this month's non-farm payroll data (NFP) fell short of expectations, coinciding with the start of the Federal Reserve's media "quiet period." Therefore, before next week's monetary policy meeting, traders will not be able to obtain the latest views of Federal Reserve officials on the current employment market conditions.
The downward revision of previous employment data released yesterday was much larger than expected, further amplifying this information gap - we now know that the weakness in the job market has increased significantly since the last time Fed officials publicly stated it.
From PPI to CPI: The transmission logic of cooling price pressure
Turning to the other dimension of the Fed’s dual mandate: Wednesday’s US PPI report also missed expectations significantly (although remained roughly in line with recent readings since the second quarter).
Currently, after the end of the silent period, the employment market and producer prices have weakened simultaneously. If this month's CPI report continues the cooling trend of PPI and shows lower-than-expected price pressure, it will create space for the Federal Reserve to launch a double interest rate cut of 50 basis points.
US inflation trend: the decline towards the 2% target has stalled, while core CPI shows signs of recovery
From the overall trend, the process of US consumer inflation falling back to the Federal Reserve's 2% target has stagnated for more than a year, during which the overall CPI year-on-year has always hovered in the range of 2.3%-3.0%.
At the same time, the core CPI, which excludes more volatile food and energy prices and better reflects the underlying trend of prices, has rebounded in recent months after hitting a year-on-year low of 2.8% earlier this year.
The Fed's policy dilemma: balancing inflation targets with weak employment
This situation puts the Federal Reserve in a policy dilemma before its meeting next week: on the one hand, persistently higher-than-target inflation may limit its room for more aggressive interest rate cuts; on the other hand, aggressive rate cuts are necessary from the perspective of the job market dimension of its dual mandate.
Judging from the potential market reaction, if the CPI report unexpectedly declines this week, it may ease this policy contradiction and push the 50 basis point interest rate cut into formal consideration - as of this writing, the market is pricing in only a 10% probability for this scenario.
As most experienced traders know, technically, the Fed's core inflation indicator for policymaking is the Core Personal Consumption Expenditures (CorePCE). However, for trading purposes, the CPI report is at least as important. This is primarily because the CPI is released several weeks earlier than the CorePCE, providing greater guidance for short-term trading decisions. As we've previously noted, the CPI has generally declined this year, but has remained stubbornly above the Fed's 2% target.
As can be seen from the above figure, the "price" sub-index in the Purchasing Managers' Index (PMI) has risen significantly in the past few months, and this trend even predates the Trump administration's formal announcement (and subsequent suspension) of the tariff policy.
Although current economic growth shows signs of slowing down, amidst continued uncertainty in trade policies, companies are forced to bear higher costs for goods and services, a factor that may put upward pressure on CPI in the coming months.
Technical Analysis
The US dollar index is in a rebound trend after a decline. The index broke below the box and rebounded back into the box. It is currently suppressed by the short-term moving average. The key pressure levels are the 98 integer mark and 98.30 above it. 97.70 is the key support price, which is the bottom of the box. The US dollar index broke below the bottom of the box and then rose back. This price is difficult to be broken in the short term. If it is broken, it will be regarded as the end of the rebound of the US dollar index and continue to develop downward.
The trend of the US dollar index means that the market has fully priced in the expectation of a 25 basis point interest rate cut by the US Federal Reserve. That is, if nothing unexpected happens, the US dollar index has temporarily bid farewell to the panic of interest rate cuts. But at the same time, US dollar bears may have also prepared bullets for the Fed's unexpected interest rate cuts. The recent rebound may also be that US dollar bears are accumulating strength and preparing chips. The rebound of the US dollar provides bears with a good position to build positions.
(Daily chart of the US dollar index, source: Yihuitong)
At 18:00 Beijing time, the US dollar index was currently at 97.96.
- Risk Warning and Disclaimer
- The market involves risk, and trading may not be suitable for all investors. This article is for reference only and does not constitute personal investment advice, nor does it take into account certain users’ specific investment objectives, financial situation, or other needs. Any investment decisions made based on this information are at your own risk.