As the Federal Reserve's Judgment Day approaches, where will the dollar and gold go? All transactions cannot avoid this line!
2025-09-15 18:40:26
On Monday (September 15), global markets exhibited a cautiously stable pattern ahead of the Federal Reserve's policy meeting. The US dollar index retreated slightly, while the 10-year Treasury yield fell further to 4.059%, a daily loss of 0.22%. Spot gold remained relatively stable, fluctuating in a narrow range around $3,643.06 per ounce. After reaching a record high of $3,673.95 per ounce last week, market sentiment remained risk-averse. US stock futures and European stocks rose slightly, while the MSCI World Index hovered below its record high. However, investors' attention was fixed on this week's Federal Reserve interest rate decision.

Signs of a softening labor market have reinforced expectations of a 25 basis point rate cut, which money markets have fully priced in, bringing the federal funds rate to 4.00%-4.25%. However, guidance from the dot plot and Chairman Powell's comments will be key variables; any hawkish signals could potentially sway the bond and foreign exchange markets.
This opening reflects the market's digestion of policy shifts: On the one hand, the Bank of Canada is also expected to cut interest rates by 25 basis points this week, while the Bank of Japan and the Bank of England are expected to maintain interest rates. On the other hand, geopolitical factors, such as the Ukrainian drone attack on Russian refineries, are being transmitted to the commodity market through a slight rise in oil prices (Brent crude oil rose to $67.143 per barrel). The euro's reaction to fluctuations in US Treasury yields was muted, rising only slightly to 1.1738. Despite the downgrade of France's sovereign rating, the lineup of ECB speakers is expected to provide further support. Overall, the calm start to the week masks potential volatility, and the bond market's reaction will be a litmus test of the Fed's dovish stance.
From a fundamental perspective, US Treasury yields are at a crossroads ahead of the Fed's decision. While the market has fully priced in a 25 basis point rate cut, if the dot plot maintains its median forecast of two rate cuts in 2025, this would contrast with the 69 basis point easing path through year-end. This pricing bias suggests that the scope for a dovish surprise has narrowed. If the statement merely acknowledges a softening labor market without explicitly pointing to an October rate cut, the bond market will face upward pressure. Economists at prominent institutions point out that the Fed's statement is expected to acknowledge the slowdown in employment but not significantly shift policy guidance, which could strengthen yield resilience. Furthermore, inflation has yet to return to target, and the potential risk of tariff rhetoric could further inflate price expectations, limiting the potential for yields to fall further from current levels.
Historically, when the Federal Reserve initiates an easing cycle, Treasury yields typically decline—bond prices rise—except for last year's unexpected rebound. This week, the focus is on avoiding a repeat of that mistake: money markets have already priced in 125 basis points of cumulative rate cuts through the end of 2026. If the dot plot doesn't signal a more aggressive path, investor disappointment could push the yield curve higher. Trump's tariff rhetoric continues to fuel market concerns, amplifying inflation uncertainty, which counteracts weaker labor data. Several traders believe the bond market is testing the Fed's dovish-hawkish balance. One senior analyst emphasized in a post, "If yields hold above 4%, a short-term rebound is likely, but we should be wary of employment signals in Powell's speech." Another institutional observer added that energy disruptions stemming from the Russia-Ukraine situation are indirectly supporting oil prices, but the transmission to the bond market will depend more on the Fed's tone.
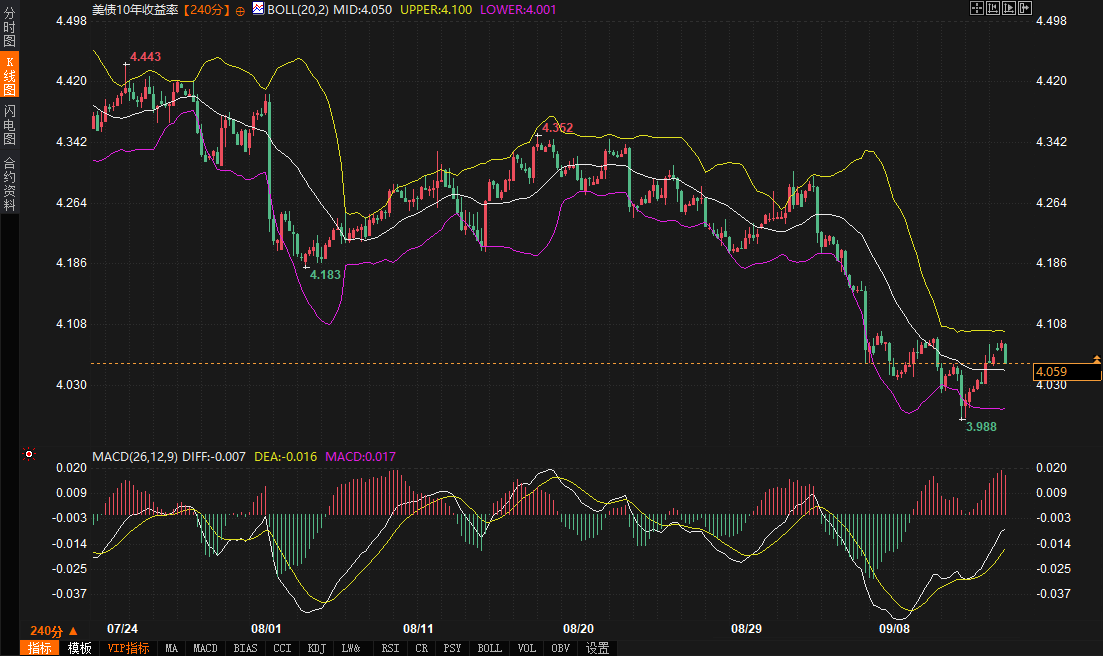
Technical analysis further confirms this stalemate. On the 240-minute chart, the 10-year US Treasury yield has fallen below the middle Bollinger Band at 4.050%, approaching the lower band at 4.001%, indicating short-term bearish dominance. The MACD indicator's DIFF line is at -0.007, the DEA line is at -0.016, and the MACD-Histogram has edged up to 0.017, suggesting a potential bottoming divergence, though the overall trend remains downward. The previous high of 4.183% has become strong resistance, while the recent low of 3.988% provides key support. Intraday focus is on the support range of 3.98%-4.01%. If it holds, it could trigger a rebound to test the resistance band of 4.05%-4.18%. Conversely, a break below the lower band could accelerate the decline, amplifying market bets on easing expectations. Combined with the initial test following last week's CPI data, the 4% level has proven its pivotal role, and traders should closely monitor sentiment before and after the Fed's decision.
This interweaving of fundamentals and technical factors highlights the short-term uncertainty of U.S. Treasury yields: subtle deviations in policy signals may push yields to fluctuate within the range of 4.00%-4.20% within 2-3 days, testing the market's ability to digest.
The fate of the US dollar often closely mirrors US Treasury yields, and this correlation will be even more pronounced this week. From the perspective of the bond market, potential upward pressure on yields will be the primary support for the US dollar. If the Fed's dot plot maintains a hawkish tone, the combined risks of failing to meet its inflation target and tariff rhetoric will limit the downside in the bond market, providing respite for the US dollar. Currently, the US dollar index fell slightly by 0.17% to 97.4339, but overall remained stable within its recent range, reflecting the market's wait-and-see attitude towards the Fed's signal of "continuous rate cuts." David Mericle, chief economist at a prominent institution, noted in his analysis that the key question at this week's meeting is whether the Fed signals this is the beginning of a series of rate cuts. The statement may emphasize a softening labor market without adjusting guidance, which would transmit mild support from the bond market to the US dollar.
The trading community is paying close attention to this transmission mechanism. One forex strategist posted, "If US Treasury yields rebound after the decision, the US dollar index will test the 97.65 mid-range, avoiding a deeper correction." Another user, citing options market data, noted that traders are positioning for a 1% volatility in Wednesday's decision, closely tied to Powell's response to housing market pressures. The strength of the Japanese yen and the Norwegian krone—USD/JPY fell to 147.42 and the krone hit a 2023 high—further underscored the dollar's relative weakness, but this stems more from regional policy expectations than from bond market forces.
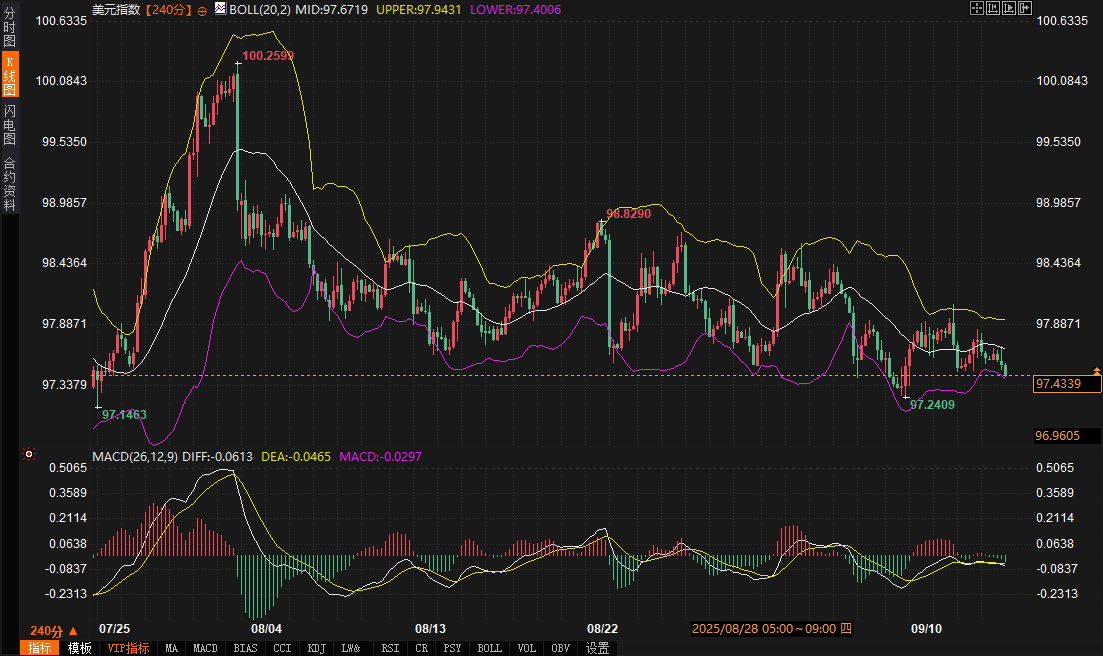
Technically, the US Dollar Index is hovering above the lower Bollinger Band at 97.4018 on the 240-minute chart, indicating immediate support. The middle band at 97.6719 has become potential resistance. The DIFF and DEA lines of the MACD are at -0.0610 and -0.0463, respectively, with the histogram flattening, suggesting weakening bearish momentum. The price has been fluctuating between a low of 97.1463 and a high of 97.9375, forming a consolidation pattern. A break of the support range of 97.15-97.40 could trigger further declines; conversely, a break above the resistance of 97.65-97.95 would confirm a reversal signal. Day traders should watch for signs of a rebound from the 97.40 level, especially before the Fed meeting, when subtle adjustments in bond yields often provide a leading indicator of the US dollar's direction.
Overall, the resilience of bond yields will dominate the short-term path of the US dollar: if the 4% support holds, the US dollar index is expected to bottom out in the range of 97.40-97.95, benefiting from the buffer of policy deviations; otherwise, the strengthening of loose pricing may drag the exchange rate to test the lower edge.
Spot gold's performance this week will be highly dependent on the safe-haven effect transmitted through the bond market. With US Treasury yields approaching the lower limit of 4%, a potential rise in bond prices often stimulates long positions in gold, strengthening its appeal as a non-interest-bearing asset. Driven by fundamentals, gold held steady at $3,643.06 per ounce after reaching a record high of $3,673.95 last week, with limited volatility. However, geopolitical disturbances, such as the Ukrainian drone attack on a Russian refinery, are indirectly supporting safe-haven demand through oil prices. A dovish Fed decision would amplify this effect, while a hawkish signal would weigh on gold in the short term, concerns about inflation and tariffs would limit losses. A commodities trader commented, "If the bond market continues its downward trend, gold will retest its highs on the back of safe-haven sentiment. We will monitor the Fed's stance on inflation." This sentiment is echoed by institutions, who emphasize that amidst a softening labor market, gold's allocation value is overflowing from the bond market.
The logic behind this risk-off transmission is clear: lower yields reduce the opportunity cost of holding gold, while market concerns about policy uncertainty—including Powell's response to the housing market—further boost demand. While the eurozone's robust interest rate outlook supports the euro, its impact on gold's global safe-haven role is limited. Conversely, Asian data, while showing some indicators below expectations, has not dampened investor optimism about stimulus, indirectly benefiting gold as a hedge.
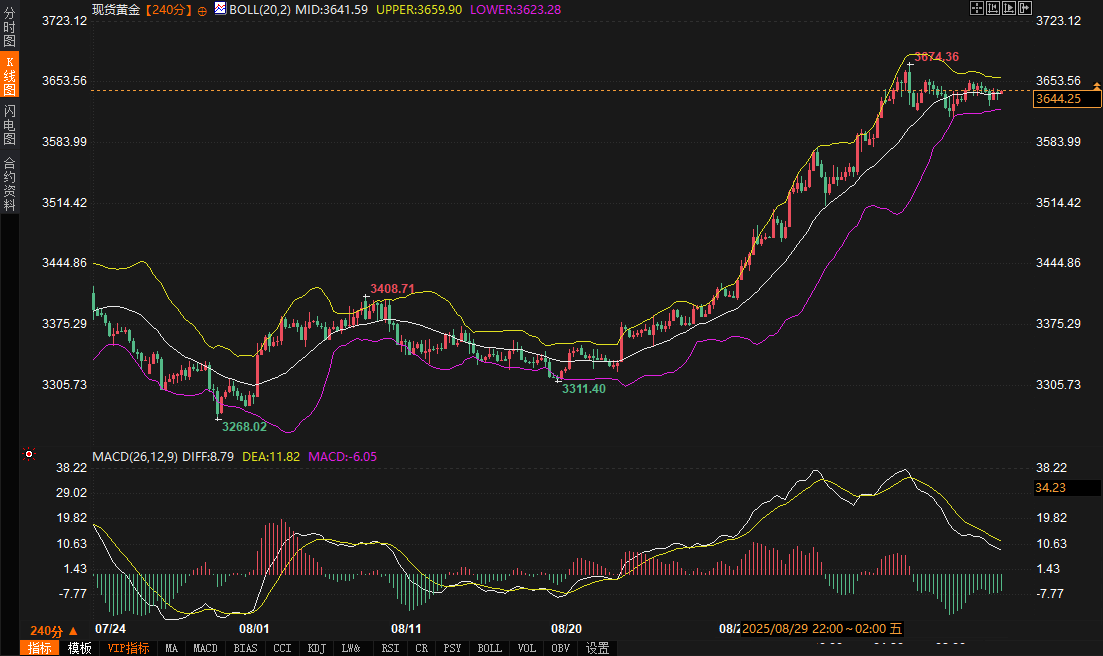
Technical indicators reinforce expectations of upward momentum. On the 240-minute chart, gold prices are trading just below the middle Bollinger Band at 3641.54, with the upper Bollinger Band at 3659.82 providing an immediate upper limit, indicating an overall upward trend. The MACD indicator is strongly bullish, with the DIFF line at 8.71 above the DEA line at 11.80, and the -6.17 histogram showing positive divergence, confirming bullish dominance. The previous high of 3674 is key resistance, while the recent low of 3611 has turned into support. A firming support range of 3623-3641 would signal a buy window; a break above the resistance of 3659-3674 would initiate an upward breakout. The intraday focus is on the 3641 level. If bond yields continue to fall, this level could be easily defended and could potentially expand upwards, with geopolitical and inflationary factors acting as catalysts.
The amplification of the safe-haven effect in the bond market makes gold more resilient in the short term: every drop in yields will strengthen gold's spillover profits.
Looking ahead to the next two to three days, US Treasury yields are expected to fluctuate between 4.00% and 4.20%, driven by the Fed's decision. If the dot plot doesn't turn out more dovish than expected, downside potential will be limited, with the 4% support level becoming a key focus. The US dollar index will mirror this trend, with a hold at the lower end of 97.40 potentially driving upward consolidation. This trend benefits from the resilience of the bond market, but caution is advised against 1% fluctuations triggered by policy disappointments. Spot gold, on the other hand, is seeking safe haven in the bond market, continuing last week's momentum. There's a high probability of trading above the 3641 mid-range, potentially testing the 3674 high. However, a hawkish surprise could lead to a brief pullback to the 3623 support level. With the overall dynamics driving the market, bond market signals are leading the way. The short-term trajectory of Huijin Asset Management will revolve around the resolution's digestion, with fine-tuning of market sentiment determining the ultimate direction.
Signs of a softening labor market have reinforced expectations of a 25 basis point rate cut, which money markets have fully priced in, bringing the federal funds rate to 4.00%-4.25%. However, guidance from the dot plot and Chairman Powell's comments will be key variables; any hawkish signals could potentially sway the bond and foreign exchange markets.
This opening reflects the market's digestion of policy shifts: On the one hand, the Bank of Canada is also expected to cut interest rates by 25 basis points this week, while the Bank of Japan and the Bank of England are expected to maintain interest rates. On the other hand, geopolitical factors, such as the Ukrainian drone attack on Russian refineries, are being transmitted to the commodity market through a slight rise in oil prices (Brent crude oil rose to $67.143 per barrel). The euro's reaction to fluctuations in US Treasury yields was muted, rising only slightly to 1.1738. Despite the downgrade of France's sovereign rating, the lineup of ECB speakers is expected to provide further support. Overall, the calm start to the week masks potential volatility, and the bond market's reaction will be a litmus test of the Fed's dovish stance.
Short-term game of US Treasury yields: the tug-of-war between policy expectations and technical support
From a fundamental perspective, US Treasury yields are at a crossroads ahead of the Fed's decision. While the market has fully priced in a 25 basis point rate cut, if the dot plot maintains its median forecast of two rate cuts in 2025, this would contrast with the 69 basis point easing path through year-end. This pricing bias suggests that the scope for a dovish surprise has narrowed. If the statement merely acknowledges a softening labor market without explicitly pointing to an October rate cut, the bond market will face upward pressure. Economists at prominent institutions point out that the Fed's statement is expected to acknowledge the slowdown in employment but not significantly shift policy guidance, which could strengthen yield resilience. Furthermore, inflation has yet to return to target, and the potential risk of tariff rhetoric could further inflate price expectations, limiting the potential for yields to fall further from current levels.
Historically, when the Federal Reserve initiates an easing cycle, Treasury yields typically decline—bond prices rise—except for last year's unexpected rebound. This week, the focus is on avoiding a repeat of that mistake: money markets have already priced in 125 basis points of cumulative rate cuts through the end of 2026. If the dot plot doesn't signal a more aggressive path, investor disappointment could push the yield curve higher. Trump's tariff rhetoric continues to fuel market concerns, amplifying inflation uncertainty, which counteracts weaker labor data. Several traders believe the bond market is testing the Fed's dovish-hawkish balance. One senior analyst emphasized in a post, "If yields hold above 4%, a short-term rebound is likely, but we should be wary of employment signals in Powell's speech." Another institutional observer added that energy disruptions stemming from the Russia-Ukraine situation are indirectly supporting oil prices, but the transmission to the bond market will depend more on the Fed's tone.
Technical analysis further confirms this stalemate. On the 240-minute chart, the 10-year US Treasury yield has fallen below the middle Bollinger Band at 4.050%, approaching the lower band at 4.001%, indicating short-term bearish dominance. The MACD indicator's DIFF line is at -0.007, the DEA line is at -0.016, and the MACD-Histogram has edged up to 0.017, suggesting a potential bottoming divergence, though the overall trend remains downward. The previous high of 4.183% has become strong resistance, while the recent low of 3.988% provides key support. Intraday focus is on the support range of 3.98%-4.01%. If it holds, it could trigger a rebound to test the resistance band of 4.05%-4.18%. Conversely, a break below the lower band could accelerate the decline, amplifying market bets on easing expectations. Combined with the initial test following last week's CPI data, the 4% level has proven its pivotal role, and traders should closely monitor sentiment before and after the Fed's decision.
This interweaving of fundamentals and technical factors highlights the short-term uncertainty of U.S. Treasury yields: subtle deviations in policy signals may push yields to fluctuate within the range of 4.00%-4.20% within 2-3 days, testing the market's ability to digest.
The bond market mirrors the US dollar's trend: yield resilience supports exchange rate stability
The fate of the US dollar often closely mirrors US Treasury yields, and this correlation will be even more pronounced this week. From the perspective of the bond market, potential upward pressure on yields will be the primary support for the US dollar. If the Fed's dot plot maintains a hawkish tone, the combined risks of failing to meet its inflation target and tariff rhetoric will limit the downside in the bond market, providing respite for the US dollar. Currently, the US dollar index fell slightly by 0.17% to 97.4339, but overall remained stable within its recent range, reflecting the market's wait-and-see attitude towards the Fed's signal of "continuous rate cuts." David Mericle, chief economist at a prominent institution, noted in his analysis that the key question at this week's meeting is whether the Fed signals this is the beginning of a series of rate cuts. The statement may emphasize a softening labor market without adjusting guidance, which would transmit mild support from the bond market to the US dollar.
The trading community is paying close attention to this transmission mechanism. One forex strategist posted, "If US Treasury yields rebound after the decision, the US dollar index will test the 97.65 mid-range, avoiding a deeper correction." Another user, citing options market data, noted that traders are positioning for a 1% volatility in Wednesday's decision, closely tied to Powell's response to housing market pressures. The strength of the Japanese yen and the Norwegian krone—USD/JPY fell to 147.42 and the krone hit a 2023 high—further underscored the dollar's relative weakness, but this stems more from regional policy expectations than from bond market forces.
Technically, the US Dollar Index is hovering above the lower Bollinger Band at 97.4018 on the 240-minute chart, indicating immediate support. The middle band at 97.6719 has become potential resistance. The DIFF and DEA lines of the MACD are at -0.0610 and -0.0463, respectively, with the histogram flattening, suggesting weakening bearish momentum. The price has been fluctuating between a low of 97.1463 and a high of 97.9375, forming a consolidation pattern. A break of the support range of 97.15-97.40 could trigger further declines; conversely, a break above the resistance of 97.65-97.95 would confirm a reversal signal. Day traders should watch for signs of a rebound from the 97.40 level, especially before the Fed meeting, when subtle adjustments in bond yields often provide a leading indicator of the US dollar's direction.
Overall, the resilience of bond yields will dominate the short-term path of the US dollar: if the 4% support holds, the US dollar index is expected to bottom out in the range of 97.40-97.95, benefiting from the buffer of policy deviations; otherwise, the strengthening of loose pricing may drag the exchange rate to test the lower edge.
Gold's safe-haven spillover from the bond market: upward momentum amid falling yields
Spot gold's performance this week will be highly dependent on the safe-haven effect transmitted through the bond market. With US Treasury yields approaching the lower limit of 4%, a potential rise in bond prices often stimulates long positions in gold, strengthening its appeal as a non-interest-bearing asset. Driven by fundamentals, gold held steady at $3,643.06 per ounce after reaching a record high of $3,673.95 last week, with limited volatility. However, geopolitical disturbances, such as the Ukrainian drone attack on a Russian refinery, are indirectly supporting safe-haven demand through oil prices. A dovish Fed decision would amplify this effect, while a hawkish signal would weigh on gold in the short term, concerns about inflation and tariffs would limit losses. A commodities trader commented, "If the bond market continues its downward trend, gold will retest its highs on the back of safe-haven sentiment. We will monitor the Fed's stance on inflation." This sentiment is echoed by institutions, who emphasize that amidst a softening labor market, gold's allocation value is overflowing from the bond market.
The logic behind this risk-off transmission is clear: lower yields reduce the opportunity cost of holding gold, while market concerns about policy uncertainty—including Powell's response to the housing market—further boost demand. While the eurozone's robust interest rate outlook supports the euro, its impact on gold's global safe-haven role is limited. Conversely, Asian data, while showing some indicators below expectations, has not dampened investor optimism about stimulus, indirectly benefiting gold as a hedge.
Technical indicators reinforce expectations of upward momentum. On the 240-minute chart, gold prices are trading just below the middle Bollinger Band at 3641.54, with the upper Bollinger Band at 3659.82 providing an immediate upper limit, indicating an overall upward trend. The MACD indicator is strongly bullish, with the DIFF line at 8.71 above the DEA line at 11.80, and the -6.17 histogram showing positive divergence, confirming bullish dominance. The previous high of 3674 is key resistance, while the recent low of 3611 has turned into support. A firming support range of 3623-3641 would signal a buy window; a break above the resistance of 3659-3674 would initiate an upward breakout. The intraday focus is on the 3641 level. If bond yields continue to fall, this level could be easily defended and could potentially expand upwards, with geopolitical and inflationary factors acting as catalysts.
The amplification of the safe-haven effect in the bond market makes gold more resilient in the short term: every drop in yields will strengthen gold's spillover profits.
Outlook for the bond-foreign exchange and finance linkage on the 2nd and 3rd days: Seeking an anchor amidst volatility
Looking ahead to the next two to three days, US Treasury yields are expected to fluctuate between 4.00% and 4.20%, driven by the Fed's decision. If the dot plot doesn't turn out more dovish than expected, downside potential will be limited, with the 4% support level becoming a key focus. The US dollar index will mirror this trend, with a hold at the lower end of 97.40 potentially driving upward consolidation. This trend benefits from the resilience of the bond market, but caution is advised against 1% fluctuations triggered by policy disappointments. Spot gold, on the other hand, is seeking safe haven in the bond market, continuing last week's momentum. There's a high probability of trading above the 3641 mid-range, potentially testing the 3674 high. However, a hawkish surprise could lead to a brief pullback to the 3623 support level. With the overall dynamics driving the market, bond market signals are leading the way. The short-term trajectory of Huijin Asset Management will revolve around the resolution's digestion, with fine-tuning of market sentiment determining the ultimate direction.
- Risk Warning and Disclaimer
- The market involves risk, and trading may not be suitable for all investors. This article is for reference only and does not constitute personal investment advice, nor does it take into account certain users’ specific investment objectives, financial situation, or other needs. Any investment decisions made based on this information are at your own risk.