The game between short-selling crowding and dot plot expectations: Is the risk of the US dollar on the lower or upper edge?
2025-09-15 20:19:43
On Monday (September 15), the US Dollar Index (DXY) continued to fluctuate in a narrow range before the US market opened, fluctuating around 97.40. It remains within the range established since the September 5th Non-Farm Payrolls report (approximately 97.30-98.25). Since the Jackson Hole speech on August 22nd, the DXY has generally been moving within a downward sloping channel. Currently, there is little short-term guidance. Key figures this week will be the August retail sales and industrial output data released on Tuesday, and the FOMC interest rate decision on Wednesday. Futures markets indicate that expectations of a Fed rate cut this week are fully priced in, with the mainstream consensus being a 25 basis point, though a few institutions are betting on a 50 basis point move. The market should be wary of surprises beyond the consensus.
1) Interest Rate Expectations and Macroeconomic Pace: CME tools indicate that this week's Fed rate cut is fully priced in, and the market maintains a high probability of further easing this year. The narrative of recent weak employment data continues to unfold—last week's unexpected surge in initial jobless claims to a new high (particularly due to unusual volatility in Texas, which may have biased the data upwards) reinforces the "employment slowdown – policy easing" logic. Meanwhile, some sell-side firms (such as Morgan Stanley) anticipate rate cuts at every remaining meeting this year. Societe Generale and Standard Chartered even proposed a "radical recalibration" of 50 basis points this week, arguing that the current "mildly restrictive" stance has persisted for too long and may be "overdone."
2) Data Outlook: This week, focus will be on Tuesday’s August retail sales (market expectations are +0.3% month-on-month) and industrial output. If consumption remains resilient and inflation continues to decline, the “mild rate cut + soft landing” scenario will continue. On the contrary, if consumption and production weaken simultaneously, defensive buying of the US dollar may re-emerge after a short-term pullback.
3) Cross-asset constraints: Equity market volatility is muted, the interest rate curve is shifting downward, and risk parity strategies offer limited marginal support for the US dollar. If rate cuts lead to a rapid improvement in financial conditions, the subsequent secondary boost to growth expectations could actually reduce the pricing of a 2026 rate cut over the longer term. Overall, the short-term narrative is dovish, but the long-term equilibrium may be more neutral.
Based on the daily chart, the current price is below the middle Bollinger band at 97.9808 and above the lower Bollinger band at 97.3066, showing a weak consolidation structure of "above the lower band - below the middle band". The upper band at 98.6549 continues to move downward from its high, and the bandwidth convergence indicates that volatility has fallen, approaching the early stage of "Bollinger Band Squeeze". The momentum of subsequent direction selection will rely more on fundamental catalysts. In terms of MACD, DIFF is -0.1774, DEA is -0.1247, and the histogram is -0.1055. The short-term momentum is still below the zero axis but narrowing, indicating that the downward momentum is decreasing and the short-term "weakness is blunting". RSI (14) is at 42.9043, which is in a neutral to weak range, neither oversold nor recovered to the strong zone (>50). Combined with the K-line structure, the real body has been small and the upper shadow has been repeated in the past two weeks, indicating that the selling pressure from above has not disappeared; but it has been supported in the 97.30-97.24 area many times, forming a "horizontal-dynamic" resonance support at the lower edge.
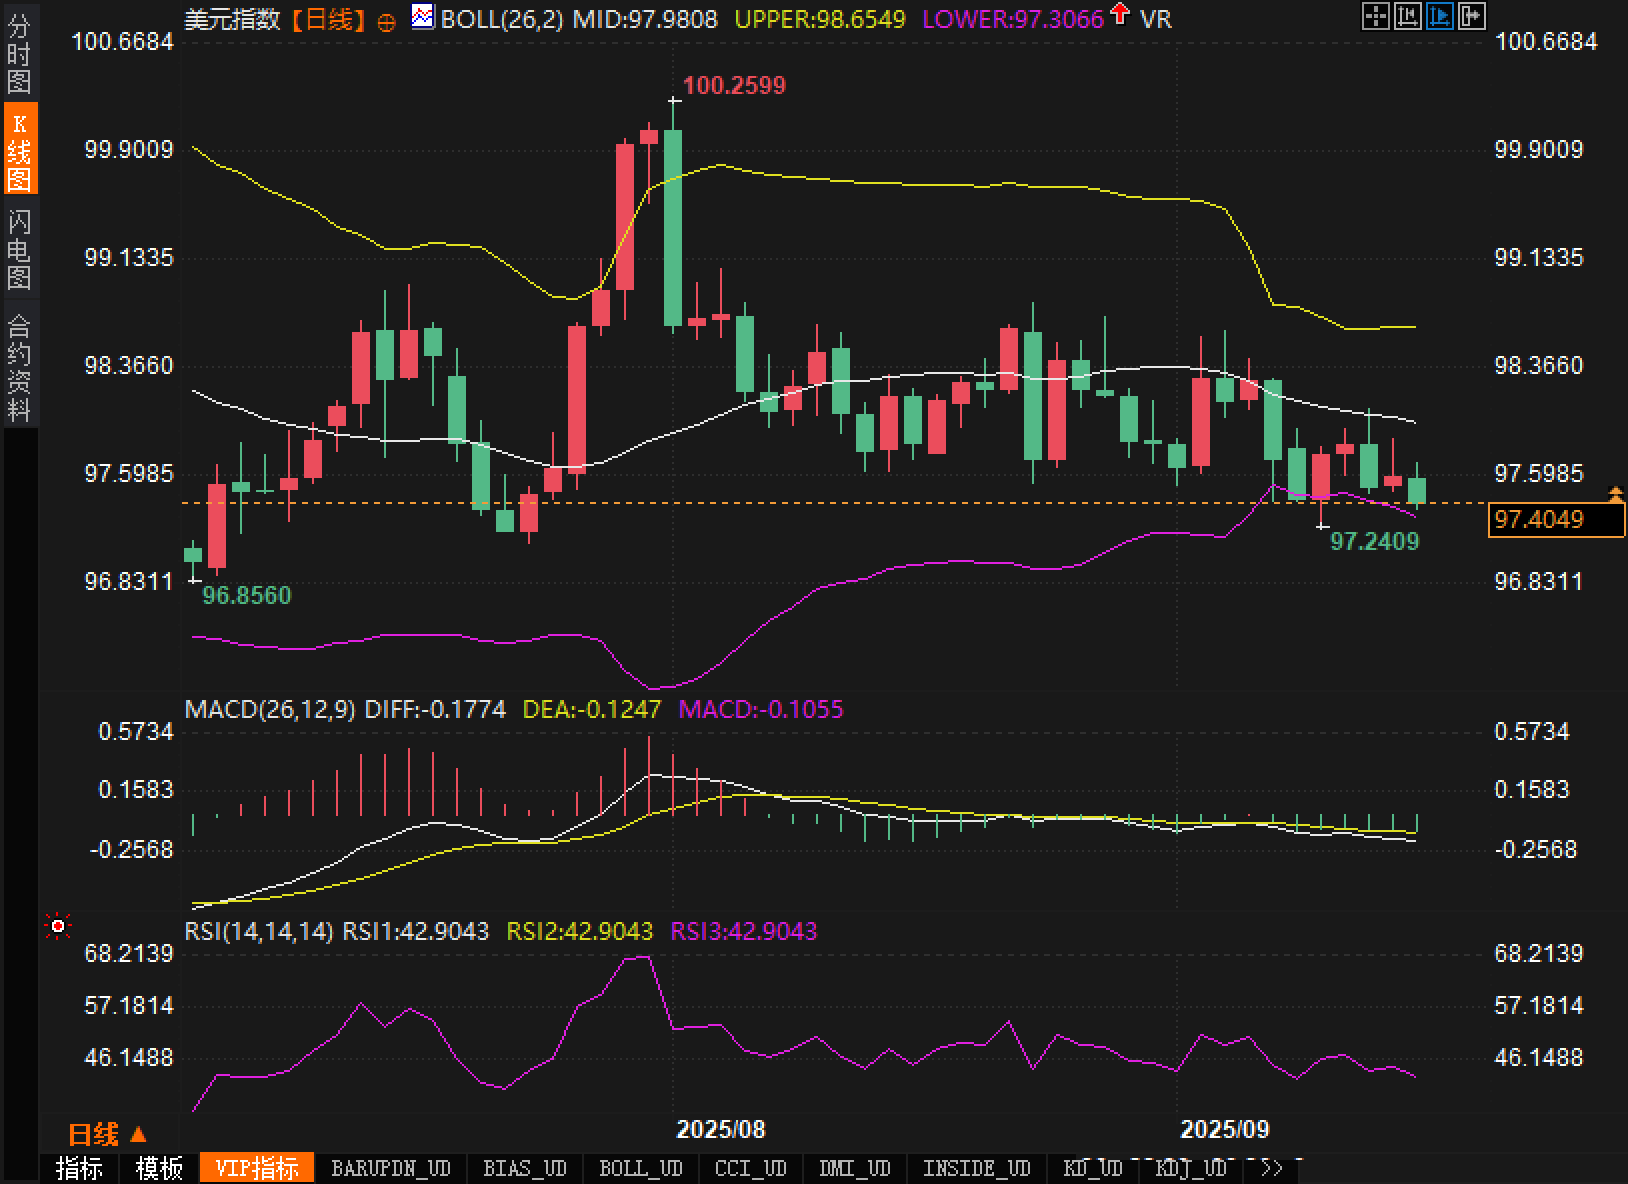
Regarding support and resistance, the first resistance level is around 98.00 (the middle Bollinger band and the area of past high trading volume), with further resistance at 98.25 (the upper limit of the range on September 5) and 98.65 (the upper Bollinger band). First support lies between 97.30 and 97.24. If this level breaks, watch for a retest of the previous low at 96.86. Conversely, a daily close above 98.00, accompanied by a continued decline in the MACD-Histogram and a crossover of the RSI above 50, could trigger a test of the 98.25-98.65 range. The overall pattern remains a low-volatility consolidation within a descending channel, with the short-term outlook more likely to see a tug-of-war between technical rebounds and weak fluctuations.
The current structure of "dovish expectations are already crowded at a high level, but the decline in growth has not yet been consistently confirmed by data" has caused sentiment to fluctuate in a "cautious bearish" direction:
Consensus: The market widely bets on a 25bp rate cut and expects two more cuts this year. The short position of the US dollar is not low, and there is a tendency to "reduce positions and wait and see" before data or meeting statements.
Reflexivity: If the interest rate cut is implemented this week and the dot plot shows a medium-term path slightly higher than market expectations, the US dollar may see "short covering after the fact"; conversely, if the statement significantly lowers the growth assessment and releases a stronger forward-looking easing signal, the lower edge of the US dollar may be vulnerable to a test.
Short term (this week - next week):
— Bearish scenario: If the decision not only cuts interest rates by 25bp, but also the statement/dot plot releases a stronger easing path or is more sensitive to downward employment, coupled with retail sales falling short of expectations, the US dollar may retest the 97.30-97.24 range, and a break below will point to 96.86.
— Bullish scenario: If the resolution emphasizes "data dependence + non-preset path" while cutting interest rates, the dot matrix will have limited downward revisions to medium-term interest rates, and retail/output are strong. The US dollar may complete a "post-squeeze upper edge breakthrough" in the range of 97.40-98.00, and test 98.25 and 98.65. At this time, the RSI crossing above 50 and the Bollinger middle band turning upward will be the key confirmation.
What traders should watch: The strength of the FOMC statement's description of the employment-inflation trade-off, the dot plot's 2026 neutral interest rate path, the structural details of retail sales (core, services, durable goods), and changes in the options market's skewness before and after the decision.
Fundamentals:
1) Interest Rate Expectations and Macroeconomic Pace: CME tools indicate that this week's Fed rate cut is fully priced in, and the market maintains a high probability of further easing this year. The narrative of recent weak employment data continues to unfold—last week's unexpected surge in initial jobless claims to a new high (particularly due to unusual volatility in Texas, which may have biased the data upwards) reinforces the "employment slowdown – policy easing" logic. Meanwhile, some sell-side firms (such as Morgan Stanley) anticipate rate cuts at every remaining meeting this year. Societe Generale and Standard Chartered even proposed a "radical recalibration" of 50 basis points this week, arguing that the current "mildly restrictive" stance has persisted for too long and may be "overdone."
2) Data Outlook: This week, focus will be on Tuesday’s August retail sales (market expectations are +0.3% month-on-month) and industrial output. If consumption remains resilient and inflation continues to decline, the “mild rate cut + soft landing” scenario will continue. On the contrary, if consumption and production weaken simultaneously, defensive buying of the US dollar may re-emerge after a short-term pullback.
3) Cross-asset constraints: Equity market volatility is muted, the interest rate curve is shifting downward, and risk parity strategies offer limited marginal support for the US dollar. If rate cuts lead to a rapid improvement in financial conditions, the subsequent secondary boost to growth expectations could actually reduce the pricing of a 2026 rate cut over the longer term. Overall, the short-term narrative is dovish, but the long-term equilibrium may be more neutral.
Technical aspects:
Based on the daily chart, the current price is below the middle Bollinger band at 97.9808 and above the lower Bollinger band at 97.3066, showing a weak consolidation structure of "above the lower band - below the middle band". The upper band at 98.6549 continues to move downward from its high, and the bandwidth convergence indicates that volatility has fallen, approaching the early stage of "Bollinger Band Squeeze". The momentum of subsequent direction selection will rely more on fundamental catalysts. In terms of MACD, DIFF is -0.1774, DEA is -0.1247, and the histogram is -0.1055. The short-term momentum is still below the zero axis but narrowing, indicating that the downward momentum is decreasing and the short-term "weakness is blunting". RSI (14) is at 42.9043, which is in a neutral to weak range, neither oversold nor recovered to the strong zone (>50). Combined with the K-line structure, the real body has been small and the upper shadow has been repeated in the past two weeks, indicating that the selling pressure from above has not disappeared; but it has been supported in the 97.30-97.24 area many times, forming a "horizontal-dynamic" resonance support at the lower edge.
Regarding support and resistance, the first resistance level is around 98.00 (the middle Bollinger band and the area of past high trading volume), with further resistance at 98.25 (the upper limit of the range on September 5) and 98.65 (the upper Bollinger band). First support lies between 97.30 and 97.24. If this level breaks, watch for a retest of the previous low at 96.86. Conversely, a daily close above 98.00, accompanied by a continued decline in the MACD-Histogram and a crossover of the RSI above 50, could trigger a test of the 98.25-98.65 range. The overall pattern remains a low-volatility consolidation within a descending channel, with the short-term outlook more likely to see a tug-of-war between technical rebounds and weak fluctuations.
Market sentiment observation:
The current structure of "dovish expectations are already crowded at a high level, but the decline in growth has not yet been consistently confirmed by data" has caused sentiment to fluctuate in a "cautious bearish" direction:
Consensus: The market widely bets on a 25bp rate cut and expects two more cuts this year. The short position of the US dollar is not low, and there is a tendency to "reduce positions and wait and see" before data or meeting statements.
Reflexivity: If the interest rate cut is implemented this week and the dot plot shows a medium-term path slightly higher than market expectations, the US dollar may see "short covering after the fact"; conversely, if the statement significantly lowers the growth assessment and releases a stronger forward-looking easing signal, the lower edge of the US dollar may be vulnerable to a test.
Market outlook:
Short term (this week - next week):
— Bearish scenario: If the decision not only cuts interest rates by 25bp, but also the statement/dot plot releases a stronger easing path or is more sensitive to downward employment, coupled with retail sales falling short of expectations, the US dollar may retest the 97.30-97.24 range, and a break below will point to 96.86.
— Bullish scenario: If the resolution emphasizes "data dependence + non-preset path" while cutting interest rates, the dot matrix will have limited downward revisions to medium-term interest rates, and retail/output are strong. The US dollar may complete a "post-squeeze upper edge breakthrough" in the range of 97.40-98.00, and test 98.25 and 98.65. At this time, the RSI crossing above 50 and the Bollinger middle band turning upward will be the key confirmation.
What traders should watch: The strength of the FOMC statement's description of the employment-inflation trade-off, the dot plot's 2026 neutral interest rate path, the structural details of retail sales (core, services, durable goods), and changes in the options market's skewness before and after the decision.
- Risk Warning and Disclaimer
- The market involves risk, and trading may not be suitable for all investors. This article is for reference only and does not constitute personal investment advice, nor does it take into account certain users’ specific investment objectives, financial situation, or other needs. Any investment decisions made based on this information are at your own risk.